Introduction
This section describes the format of the dispersion observations
used in the tomographic analysis.
The data for the inversion consists of phase and group velocities
obtained by processing earthquake and ambient noise data. After
deconvolving earthquake recordings to ground velocity group
velocities are obtained using multiple filter analysis. Errors are
introduced primarily due to errors in the earthquake source
parameters. Ambient noise processing do not have source parameter
errors since it is assumed that the individual instruments
location and timing are known. Both sets of data were processed
using the Computer Programs in Seismology package program do_mft
which calls sacmft96 to estimate group velocities and
also the phase velocities when do_mft is told to process
the inter-station Green's functions obtained from the
cross-correlation of ambient noise. The program do_mft
sets up the processing parameters for sacmft96 and permits
visual editing of the output of sacmft96 to identify good
dispersion values according to the particular mode. Almost always
the output is for the fundamental mode.
The next figures display the interactive screens for the analysis
of the interstation Green's function obtained by stacking the
cross-correlations of 377 days between the USArray TA stations
R28A and U35A, which are 321 km apart. The first figure displays
the group velocity estimates. The second figure shows the phase
velocity analysis screen.
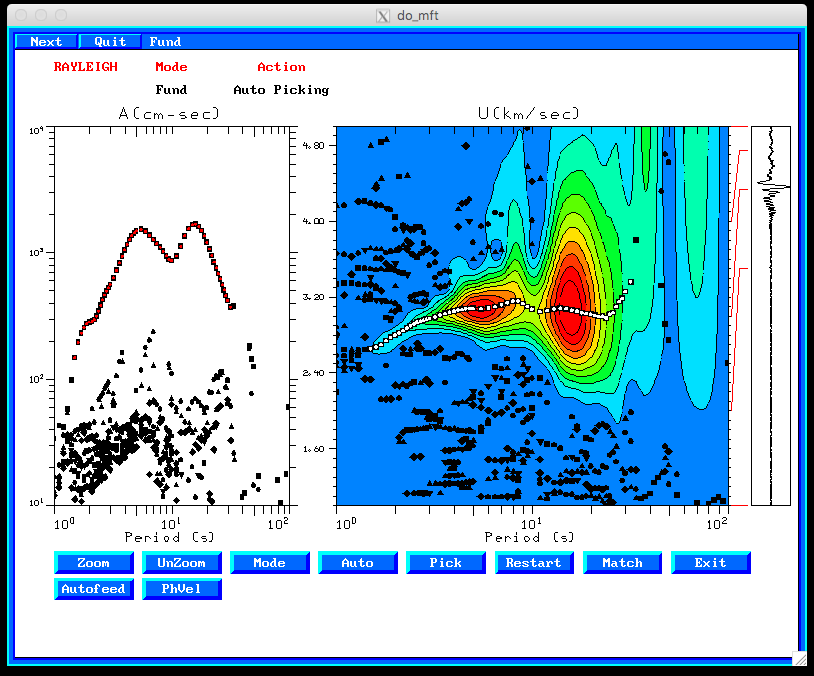
The group velocity analysis screen consists of three
frames. The left displays spectral amplitudes as a
function of period. for earthquake studies, the spectral
amplitudes could be used to determine source mechanism an
moment. The center frame displays the group velocity
analysis. At each period the ten larges envelope peaks are
indicated by black symbols. The colored contours are
related to the spectral amplitudes with red for the
largest absolute amplitude. In this figure the white dots
are the selected dispersion values. finally the right
panel displays the trace being analyzed. The red lines
relate the timing on the trace to a group velocity. This
is an exceptionally rare, very good cross-correlation.
|
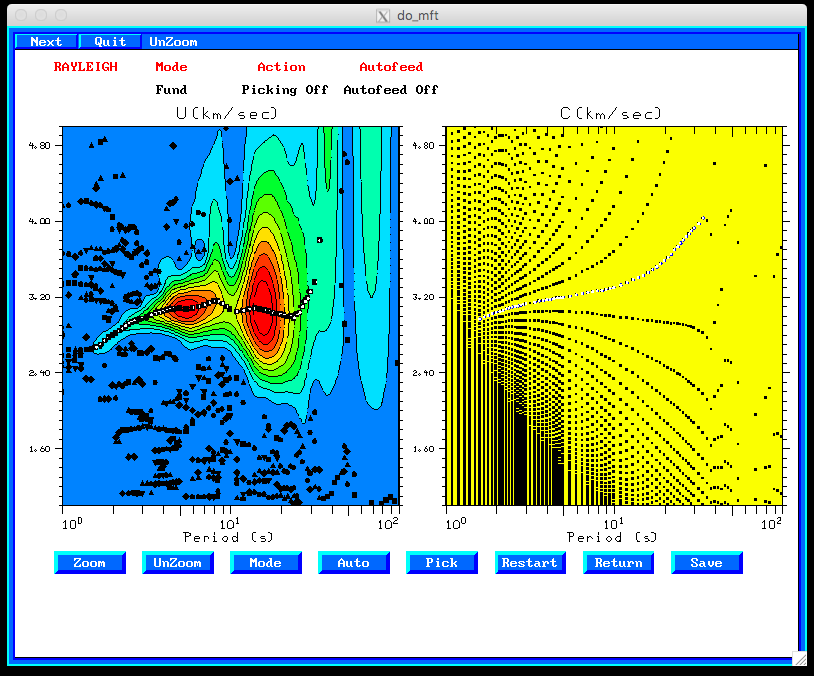
The phase velocity analysis screen consists of two frames.
The left displays the group velocity analysis while the
right displays the phase velocity estimates. at any one
period, the phase velocity is based on that part of the
group velocity analysis which had the larges spectral
amplitude. Thus modes may get mixed up, but not in these
case. The multiple phase velocity curves correspond to
different values of 2Nπ radians to the phase. The proper
branch is selected on the basis of known dispersion at
long periods.
|
Data format
There are two types of dispersion values: group velocity and
phase velocity. These typically have a .dsp or a .phv,
respectively, as part of the file name, e.g., R38ABHZU35ABHZ.WSTK.dsp
and R38ABHZU35ABHZ.WSTK.phv. Earthquake group velocity
observations may have originally and a file name such as SLMNMBHZ.dsp.
Group velocities
An example of ambient noise group velocity estimates is the
following:
MFT96 R U  0          32     3.35749     1.12171   321.5875  232.1  3.6960e+02 38.186798 -93.905602 36.370899 -96.731796 0 1 31.700001 COMMENT: U35A BHZ 1970 1 0 0
MFT96 R U  0          30     3.25319     0.98728   321.5875  232.1  4.1660e+02 38.186798 -93.905602 36.370899 -96.731796 0 1 28.920000 COMMENT: U35A BHZ 1970 1 0 0
An example of the group velocity estimate from an earthquake is
the following:
MFT96 L U 0 36.00000 3.56770 0.36784 1245.69995 151.2 0.2998E-01 37.070000 -104.699997 27.064699 -98.683296 0 1 35.18 COMMENT: 034A BHT 2011 235 5 46
The formats are the same except for the comment. The column
entries are as follow:
      Column   Entry
        1      MFT96     This indicates group velocity
        2      type      R for Rayleigh; L for Love
        3      U         Observation U for group velocity
        4      mode      0 is fundamental
        5      Period(s)
        6      group velocity
        7      error in velocity - this is a place holder and is obtained from
                dU/U = dt / t where dt is the filter period and t is the travel time
                this could be used for relative weighting
        8      distance in km
        9      azimuth from source to station or station 1 to station 2
       10      amp - spectral amplitude in units of cm-sec if this is earthquake data
       11      latitude earthquake or station 1
       12      longitude earthquake or station 1
       13      latitude of station or station 2
       14      longitude of station or station 2
       15      ictl  - used for plotting
       16      isymb - used for plotting
       17      instantaneous period which could be used instead of the filter period
       18      COMMENT:    keyword to indicate comment
               This is followed by 6 columns which give station name, station component
               year, day of year, hour and minute for earthquake processing.
               For ambient noise processing, the reference station name and component are given and the year, day of year, hour and minute are
               those of the epoch since ambient noise processing does not use absolute time.

               The purpose of the comment is to identify event and station information.
Phase velocities
An example of the phase velocity output is
PHV96 R C  0          34     4.02984     0.00100   321.5875  232.1  3.7620e+02 38.186798 -93.905602 36.370899 -96.731796 0 1 34.970001 COMMENT: U35A BHZ 1970 1 0 0 1.699000 3.794800 0
PHV96 R C  0          32     3.97213     0.00100   321.5875  232.1  3.6960e+02 38.186798 -93.905602 36.370899 -96.731796 0 1 31.700001 COMMENT: U35A BHZ 1970 1 0 0 -2.587660 3.357500 -1
The format is similar to that for the group velocity. The column
entries are as follow:
      Column   Entry
        1      PHV96     This indicates phase velocity
        2      type      R for Rayleigh; L for Love
        3      C         Observation C for phase velocity
        4      mode      0 is fundamental
        5      Period(s)
        6      group velocity
        7      error in velocity - this value is just a column filler and has no value but must be there
        8      distance in km
        9      azimuth from source to station or station 1 to station 2
       10      amp - spectral amplitude no used
       11      latitude station 1
       12      longitude station 1
       13      latitude station 2
       14      longitude station 2
       15      ictl  - used for plotting
       16      isymb - used for plotting
       17      instantaneous period which could be used instead of the filter period
       18      COMMENT:    keyword to indicate comment
               This is followed by 6 columns which give station name, station component
               year, day of year, hour and minute for earthquake processing.
               For ambient noise processing, the reference station name and component are given and the year, day of year, hour and minute are
               those of the epoch since ambient noise processing does not use absolute time.

               The purpose of the comment is to identify event and station information.
Data sets for inversion
The data sets are organized by earthquake for earthquake group
velocity analysis or by network for the ambient noise analysis.
All dispersion results are combined into one large ASCII file for
the tomography inversions. The scripts that combine the
observations can be modified. Presently the duplicate the ambient
noise estimates but not the earthquake group velocity estimates.
This is an ad hoc way of stating that the ambient noise
estimates are better in the sense that those do not have source
parameter errors.