Note that these are generic response files. For actual use, there should be similar files witht eh actual station names. In addition there should be a file for each component.
The start and end dates must also be changed.
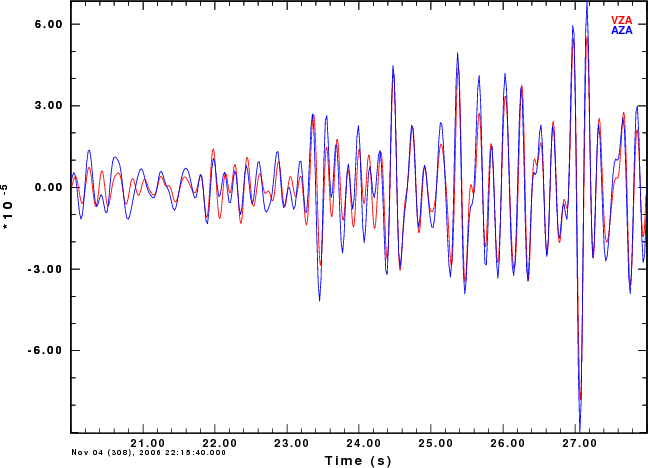
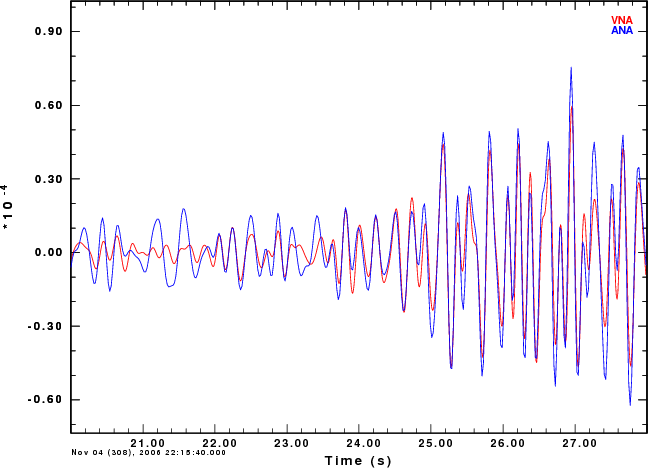
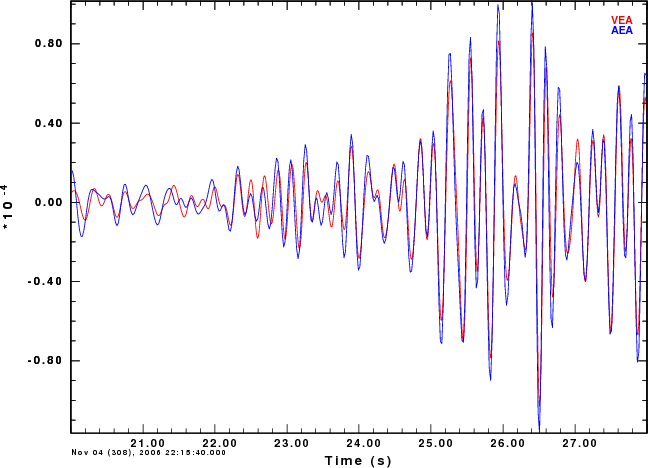
Waveforms from the CERI Earthworm tank for the station LNXT were obstined for the eathquake on Nov 04 (308), 2006 22:15:40.000. The following traces were examined: LNXT.HHE.NM LNXT.HHN.NM LNXT.HHZ.NM LNXT.HNE.NM LNXT.HNN.NM LNXT.HNZ.NM The HH traces were sampled at 100 HZ and the HN at 50 Hz.
The data processing consisted of converting the response to acceleration sensitivity in units of meters/s/s using evalresp. The signals were deconvolved to ground deisplacement in units of m/s/s using the following script:
!/bin/sh

evalresp CERI HHZ 2006 002 0.01 25 1000 -f RESP.NM.CERI..HHZ -u 'acc'
evalresp CERI HNZ 2006 002 0.01 25 1000 -f RESP.NM.CERI..HNZ -u 'acc'


for COMP in Z N E
do
gsac << EOF
r LNXT.HH${COMP}.NM
rtr
taper
transfer from eval subtype AMP.NM.CERI..HHZ PHASE.NM.CERI..HHZ to none freqlimits 0.1 0.2 8 10
w V${COMP}A

r LNXT.HN${COMP}.NM
rtr
taper
transfer from eval subtype AMP.NM.CERI..HNZ PHASE.NM.CERI..HNZ to none freqlimits 0.1 0.2 8 10
w A${COMP}A

quit
EOF


#####
#       compare traces
#####
gsac << EOF
r V${COMP}A A${COMP}A
color rainbow
rtr
fileid name
bp c 2 6 n 3 p 2
xlim o 20 o 28
bg plt
p overlay on
p
quit
EOF

#####
#       convert to a PNG file
#####
for i in P001
do
plotnps -F7 -W10 -EPS -K < $i.PLT > j
convert -trim j T${COMP}.png
rm j
done

done
The comparison plots showing the bandpass filtered Z, N ane E traces (2 - 6 Hz band) are shown in the figures below:
|
|
|
|
Addendum 20061101.  gmew likes nanometers not micrometers.

Response Notes Mitch Withers 20061019

Notes are primarily geared toward fixing up the response files
used by gmew (ew module that generates station amplitudes for
eventual feeding to shakemap).

These notes also reflect changes now that all the CMG5TD's are
+-2g (instead of +-4g as before; oops) and that all the cmg40t's
now use dm24's (instead of dm16's).

**********************************************************************
>From the Guralp documentation:
CMG5TD
Poles (no Zeros) in Hz:

-63.7927 +- 90.3864i
-209.656 +  0i
-755.898 +  0i

Normalizing factor at 1Hz: 1.9396e9

To convert from Hz to radians, multipy each pole and zero by 2pi.
Normalizing factor must also be scaled to account for the discrepency
in the number of factors of 2pi in the poles (denominator ) and zeros
(numerator) of the transfer function.  Multiply A0 by 2pi*(np-nz).
That is, A(radians) = A(Hz) * (2*pi)^(np-nz)  where np and nz are
the number of poles and number of zeros respectively.  So, the response
of a 5td (without the sensor gain) in radians is

Poles (no Zeros) in radians:

-400.8214 +- 567.9145i
-1317.3 +  0i
-4749.4 +  0i

Normalizing factor at 1Hz: 3.0230e12

Note that when plotting the above transfer function convolved with an
impulse the flat part will not be of amplitude 1.  Rather it will
be of amplitude equal to the sample rate.

To convert from acceleration to displacement, multiply the acceleration
response by two factors of i*omega (-w^2).  Equivalenty, add two zeros.

The 5td sensor has a constant of about 0.256 V/m/s2.

The DM24 has a digitizer constant of about 1.9e-6 volts/count.

So the overall system gain (excludes any pole/zero factors) is about
7.422e-6 m/s^2 per count (or about 7.422 micron/s per count).

Soo, the constant in the complete transfer function (in microns/count
and radians) is the normalizing factor (radians) * 1e6 (microns/meter) *
7.422e-6 (m/s^2 per count) = 7.422 * 3.0230e12 = 2.2437e13.

Soo, the complete transfer function for a cmt5td set to +-2g will be
(in microns/count and radians) in sac format:
ZEROS 2
POLES 4
-400.8214 -567.9145
-400.8214  567.9145
-1317.3 0.0
-4749.4 0.0
CONSTANT 2.2437e13

The above numbers are valid for the +-2g instruments.  For the +-4g
(we shouldn't have anymore as of this writing) it was around
0.128 V/m/s2 and the same digitizer constant.

**********************************************************************

CMG40T/DM24

The 40T sensor uses these poles/zeros in Hz

zeros
0 + 0i
0 + 0i
159 + 0i
poles
-23.56e-3 +- i23.56e-3
-50 +0i

Normalizing constant is -0.314. Converting from Hz to radians we note
that the number of poles and the number of zeros are equal so the
normalizing constant remains -0.314 and a sac format response would be:

ZEROS 3
999.0265
POLES 3
-0.1480  0.1480
-0.1480 -0.1480
-314.1593
CONSTANT -0.314

The 40T gain is nominally 800 volts/m/s.  The dm24 gain is nominally
1.127 microVolts/count. So the total gain in micron/s/count is 1.127*800
micron/s per count = 901.6.  Multiplying by the normalizing
constant (-0.314) we get -283.1024 micron/s/count.  Add a zero at the
origin to convert from velocity to displacement and we get the following
sac format total transfer function for a 40T/dm24 in radians and
microns/count:

ZEROS 4
999.0265 0.0
POLES 3
-0.1480  0.1480
-0.1480 -0.1480
-314.1593 0.0
CONSTANT -283.1024

Whew! I think we're done.