Purpose
The purpose of this study is to test the concept of deploying high- and
low-gain Episensors together with a
6-channel datalogger for the purpose of capturing large ground motions
(±2g full scale) and weak motions.
The weak motions are obtained by setting the internal jumpers on the
Episensor to record in the ½ or ¼ g full scale. When
connected to the Q330 datalogger this means that the systems are
designed to record ±½g and ±¼g,
The reasons for such a combination of hi- and lo-gain accelerometers
are
- to maintain standards for capturing large earthquake motions
- to be able to locate and use recordings of small earthquakes
- to verify the operation of the field unit, e.g., timing,
polarities by periodically studying teleseisms
- to use the high-gain accelerometer as a replacement for a
standard short-period seismometer
This comparison focuses on the M=6.2 South of Panama
earthquake of March 12, 2009 at 2323UT.
For duplication of these results, all processing steps are presented
in detail.
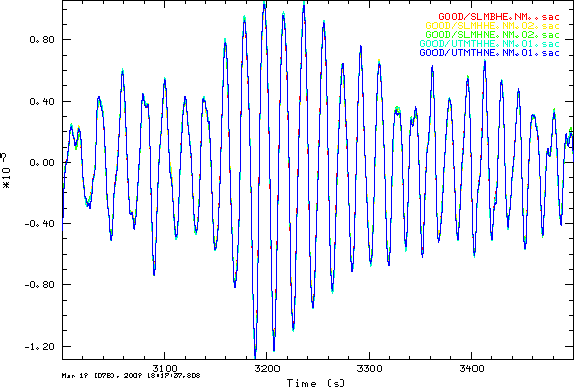
The Good
For this test, and for other testing we have the following systems that
recorded the M=7.9 Tonga event of 2009 03 19 18 17 37: Q380 with
and STS-2, Q330HR with a ±½g Episensor on the HR
channels and a ±¼g Episensor on the 24-bit
channels, and another Q330HR with a 40 second Trillium on the HR
channel and a ±2g Episensor on the other three channels.
The Trillium/Episensor/Q330HR system is being tested for replacement of
the current system at UTMT.
For this test we compare the recordings of an STS-2/Q680 to two
episensors, one set at ½
g full scale (HH channels) and the
other set at ¼ g
full scale (HN channels) on the bed rock pier
at the on campus SLM vault. The earthquake studied is the
2009/03/12 23:23:35 South of Panama event, 5.628N 82.776W with M=6.2.
The SLM station is at an arc distance of 33.6 degrees.
The first test consists of removing the instrument response to convert
all traces to ground velocity. To accomplish this I use the following
pole-zero response files
The instrument responses are in a Sac pole-zero format and provide the
transfer function from gound motion in meters to digital counts. This
pole-zero representation does not and cannot include the effect
of the digital FIR filters.
All traces are converted to ground velocity using the gsac (sac) command
transfer from polezero subtype pzfile TO VEL FREQLIMITS 0.002 0.003 ${FHL} ${FHH}
where FHL = 0.25/DT, and FHH (Nyquist frequency) = 0.5/DT, and DT is
the sample rate of the data stream (0.05 sec for the BH channel and
0.01 sec for the HH channel)
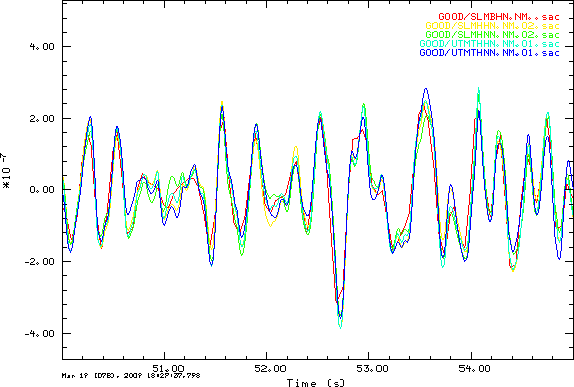
Pre-P noise
To look at the noise before P, I read in the ground velocity files and
applied the following gsac
commands:
rtr
hp c 1 n 3
lp c 5 n 3
taper w 0.05
xlim o 650 o 655
color rainbow
fileid name
bg plt
p overlay on
The filtering emphasizes the high frequency ground noise content. The
overlay of all five processed signals for each component is given
in the next figure:
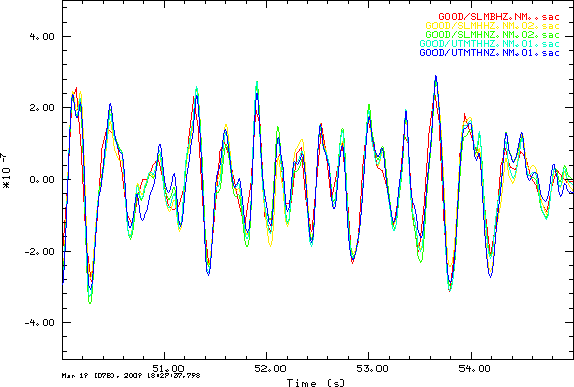
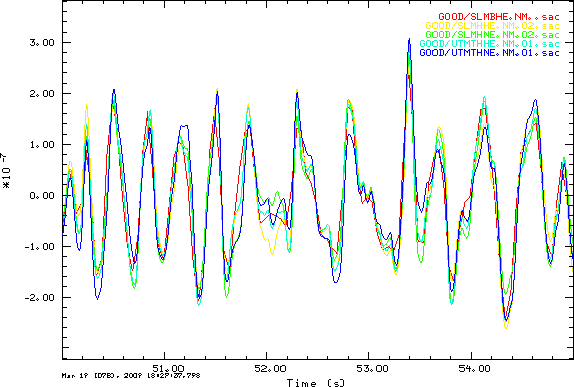
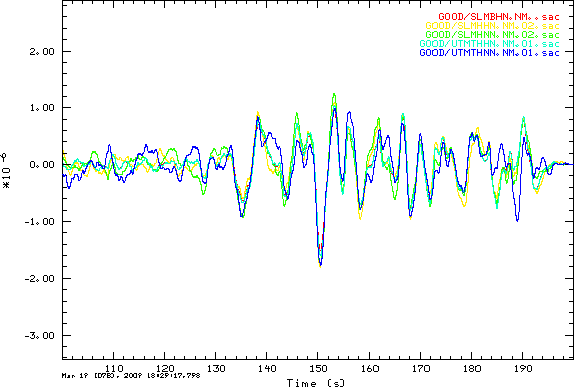
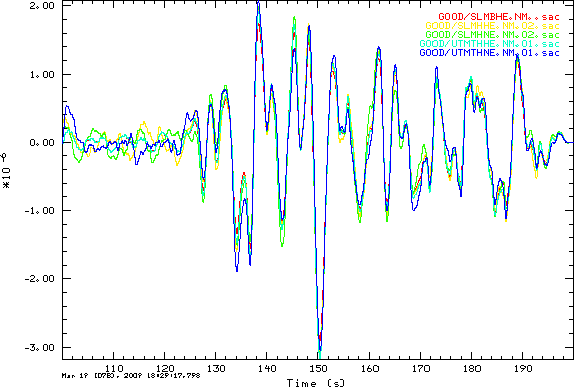
P-wave signal
To look at the P-wave signal, I read in the ground velocity files and
applied the following gsac
commands (note that the backazimuth is 248º which means that the P
and Rayleigh waves will be stronger on the EW component than on the NS
component.
rtr
hp c 0.1 n 3
lp c 1 n 3
taper w 0.05
xlim o 800 o 900
color rainbow
fileid name
bg plt
p overlay on
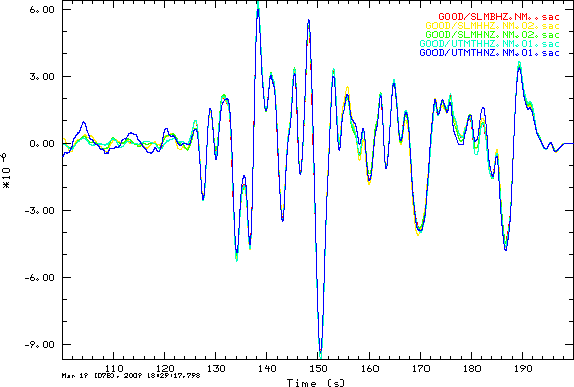
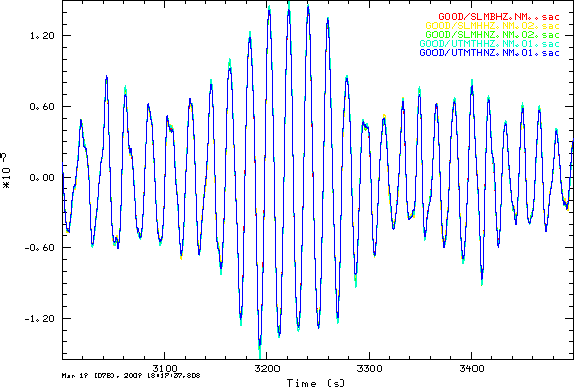
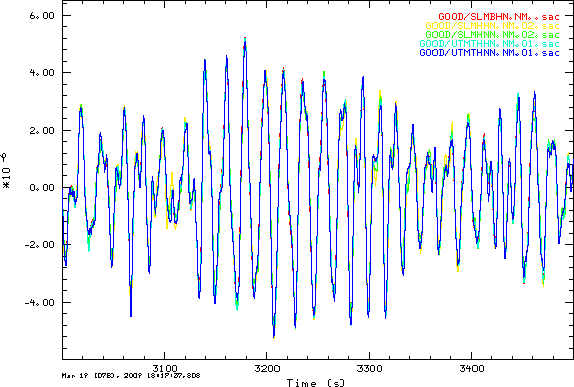
Surface-wave signal
To look at the surface-wave signal, I read in the ground velocity files
and applied the following gsac
commands:
rtr
hp c 0.1 n 3
lp c 1 n 3
taper w 0.05
xlim o 3000 o 3500
color rainbow
fileid name
bg plt
p overlay on
Computation of Constant for Pole Zero file
The documentation for the
Episensor provides the normalization constant of 2.56E+13 for the
pole-zero representation. This value must be multipled by the
sensor gain and by the A/D constant to provide the constant in the Sac
pole-zero file:
Episensor Normalization
Factor: 2.46E+13
Episensor:
1/4g = 80V/g =
8.16V/m/s/s (this gives a +- 1/4 g recording)
1/2g = 40V/g = 4.08
V/m/s/s (this gives a +- 1/2g recording)
2g =
10V/g = 1.02V/m/s/s (this gives a += 2g recording)
Q330 A/D conversion factor:
4.194E+5 counts/V
Q330HR Channels 1-3 conversion
factor: 1.677722E+6 counts/V
Q330HR Channels 4-6 conversion
factor: 4.19430E+5 counts/V
Sac constant for Q330HR Channels
1-3 and 1/2g Episensor: 4.08 *2.46e+13 * 1.6777E+6 = 16.83896E+19
counts/m/s/s
Sac constant for Q330HR Channels
4-6 and 1/4g Episensor: 8.16 *2.46e+13 * 4.1943E+5 = 8.419480E+19
Sac constant for Q330
2g
Episensor: 1.02 * 2.46e+13 * 4.1943E+5 =1.05236e+19
(corrected March 19, 2009)
March 19, 2008 2043UT
For testing after this time the 1/4g is attached to channels 1-3 and
the 1/2g is attached to channels 4-6. the constants computed are now
Sac constant for Q330HR Channels
1-3 and 1/4g Episensor: 8.16 *2.46e+13 * 1.677E+6 = 33.67792E+19
counts/m/s/s
Sac constant for Q330HR Channels
4-6 and 1/2g Episensor: 4.08 *2.46e+13 * 4.194E+5 = 4.209740E+19
Last changed March 26, 2009