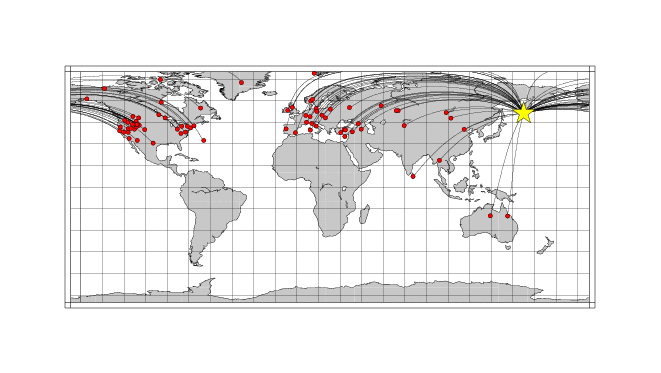
Location of the earthquake (yellow star) and great circle path from the epicenter to each station (red) [created using GMT (Wessel, P., and W. H. F. Smith, New version of Generic Mapping Tools released, EOS Trans. AGU, 76 329, 1995.)]
2006/08/24 21:50:39 51.19 157.52 70
The following compares this source inversion to the USGS Rapid Moment Tensor Solution and to the Harvard CMT solutions, if they are available.
Mw=6.3

2006/08/24 21:50:39    EVID:
LAT: 51.19N, LON: 157.52E, DEPTH:  35
Mw: 6.3, mb: 0.0, Ms: 0.0
Mo=  0.336E+26 (dyne-cm)

No. of Stations:  78, GAP: 121
Error (clvd/dc)*100=   7.93
Bandpass:  12 -  60 sec
Nodal plane parameters
      strike     dip    rake
NP1:      50      62     107
NP2:     197      32      61

             ---------######
          --------#############
       --------###################
     --------#######################
    -------#########################-
   -------#########################---
  -------#########   #############-----
 -------########## T #############------
 -------##########   ############-------
 ------########################---------
 ------#######################----------
 ------#####################------------
 ------####################-------------
 ------##################---------------
  -----###############-----------------
   -----###########-------------   ---
    ----#######----------------- P --
     ####-----------------------   -
       ###------------------------
          ##-------------------
             #--------------


Stat Dist Az Misfit   Stat Dist Az Misfit
AAK   54 295  0.24    ACSO  74  43  0.48
AHID  59  59  0.26    ANTO  77 319  0.20
AQU   81 333  0.20    ARU   53 317  0.27
BBSR  88  34  0.46    BINY  75  37  0.29
BJT   30 264  0.57    BLA   78  43 99.66
BMN   57  64  0.24    BMO   54  60  0.33
BNI   80 339  0.25    BOZ   56  56  0.20
BR13  77 318  0.28    BRVK  50 308  0.99
BW06  59  58  0.25    CART  89 343  0.22
CBN   78  41  0.34    CM31  56 257  0.30
CMB   56  68  0.25    CSS   81 316  0.25
CTAO  71 191  1.14    DIV   32  49  0.58
DSB   75 350  0.15    DUG   59  62  0.25
EGMT  56  53  0.30    ELK   58  63  0.23
ERPA  74  40  0.27    ESK   72 348  0.20
EYMN  64  43  0.14    FCC   55  36  0.19
GNI   71 311  0.22    HAWA  52  60 *****
HLID  56  60  0.33    HOPS  54  69  0.27
HRV   77  34  0.13    HWUT  59  60  0.35
INK   36  35  0.26    ISCO  64  58  0.39
ISP   79 320  0.15    JCT   74  61  0.20
KBS   48 351  3.94    KIV   69 315  0.25
KONO  66 342  0.63    LOHW  58  58  0.44
MALT  76 314  0.24    MOOW  58  58  0.54
MORC  73 334  0.21    MTE   87 348  0.16
NAO0  65 342  0.23    OBN   63 326  0.28
PAL   77  37  0.20    PALK  76 264  0.26
PFO   62  70  0.31    PSZ   74 331  0.16
RES   45  20  0.90    RGN   70 338  0.13
RRI2  58  58  0.44    RUE   72 337  0.18
SCHQ  68  25  0.25    SNOW  58  58  0.44
STU   76 339  0.14    SUMG  56   5  0.22
SUW   68 333  0.15    TLY   32 292  0.51
TPAW  58  58  0.45    TPH   58  66  0.26
TUC   66  67  0.20    ULM   61  44  0.25
ULN   32 284  0.65    VLC   80 336  0.26
VSL   85 335  0.18    WALA  53  54  0.27
WLF   76 341  0.15    WRAB  73 202  0.85
YBH   53  66  0.58    ZRNK  51 308  0.42
 Misfit > 1 heavily downweighted
|
06/08/24 21:50:39.80
 NEAR EAST COAST OF KAMCHATKA
 Epicenter:  51.188  157.523
 MW 6.5

 USGS MOMENT TENSOR SOLUTION
 Depth  36         No. of sta: 87
 Moment Tensor;   Scale 10**18 Nm
   Mrr= 5.39       Mtt=-1.83
   Mpp=-3.56       Mrt= 0.98
   Mrp= 1.91       Mtp=-3.16
  Principal axes:
   T  Val=  5.79  Plg=79  Azm=286
   N        0.56       4       36
   P       -6.35      10      127

 Best Double Couple:Mo=6.1*10**18
  NP1:Strike=222 Dip=35 Slip=  97
  NP2:        33     55        85

               -------
          -----------------
        -------------#######-
      ----------############---
    ---------###############-----
   --------#################------
   -------##################------
  ------###################--------
  -----########   #########--------
  -----######## T ########---------
  ----#########   #######----------
  ----##################-----------
   ---#################-----------
   ---###############--------   --
    --#############---------- P -
      -##########------------
        #####----------------
          -----------------
               -------
|
August 24, 2006, NEAR EAST COAST OF KAMCHATKA, MW=6.5

Goran Ekstrom

CENTROID, MOMENT TENSOR SOLUTION
HARVARD EVENT-FILE NAME C082406A
DATA USED: GSN
L.P. BODY WAVES: 67S,176C, T= 40
MANTLE WAVES:    62S,139C, T=125
CENTROID LOCATION:
ORIGIN TIME       21:50:42.3 0.1
LAT 50.92N 0.01;LON 158.07E 0.01
DEP  51.3 0.4;HALF-DURATION  4.1
MOMENT TENSOR; SCALE 10**25 D-CM
  MRR= 5.46 0.04; MTT=-1.49 0.04
  MPP=-3.97 0.04; MRT= 1.18 0.06
  MRP= 2.48 0.06; MTP=-2.41 0.03
 PRINCIPAL AXES:
 1.(T) VAL=  6.12;PLG=76;AZM=290
 2.(N)      -0.03;     2;     30
 3.(P)      -6.09;    13;    121
BEST DOUBLE COUPLE:M0=6.1*10**25
 NP1:STRIKE=214;DIP=32;SLIP=  95
 NP2:STRIKE= 29;DIP=58;SLIP=  87

            -----------
        ----------#########
      --------############---
    -------###############-----
   -------################------
  ------##################-------
  -----###################-------
 -----#######   #########---------
 -----####### T #########---------
 ----########   ########----------
 ----##################-----------
  ---#################-----------
  ---################-------   --
   --##############--------- P -
    --############----------
      -########--------------
        ####---------------
            -----------
|
The following broadband stations were used for the source inversion: AAK ACSO AHID ANTO AQU ARU BBSR BINY BJT BLA BMN BMO BNI BOZ BR131 BRVK BW06 CART CBN CM31 CMB CSS CTAO DIV DSB DUG EGMT ELK ERPA ESK EYMN FCC GNI HAWA HLID HOPS HRV HWUT INK ISCO ISP JCT KBS KIV KONO LOHW MALT MOOW MORC MTE NAO01 OBN PAL PALK PFO PSZ RES RGN RRI2 RUE SCHQ SNOW STU SUMG SUW TLY TPAW TPH TUC ULM ULN VLC VSL WALA WLF WRAB YBH ZRNK
|
Location of the earthquake (yellow star) and great circle path from the epicenter to each station (red) [created using GMT (Wessel, P., and W. H. F. Smith, New version of Generic Mapping Tools released, EOS Trans. AGU, 76 329, 1995.)] |
All observed and Greens function waveforms are corrected to instrument response to ground velocity in meters/sec for the passband of 0.01 - 5 Hz. Next tre traces were bandpass filtered by the application of the following high- and low-pass stages:
hp c 0.0167 2
lp c 0.0833 2
int
The traces were next integrated to ground displacment in meters. Finally waveforms were cut from 30 seconds before to 140 seconds after the P arrival so that the direct P wave, pP and perhaps the sP are included.
The source inversion is a multipass operation since a lower frequency filter band is used for larger earthquakes and since a search is made over depth. Up to three passed of the outer loop are made, after which the moment magnitude is determined and filter settings readjusted. The inner loop over depth samples all depths from 0 to 800 km with 5 km increments in depth to 50 km, followed by 10 km depth sampling for the remaining range.
The following filter ranges are used according to the moment magnitude Mw:
   FILTER_BAND   FH(s)  FL(s)
       1           60     12      Mw < 6.4
       2          100     20      6.4 < Mw <= 6.9
       3          120     40      Mw > 6.9
For this data set the favored solution is
WVFMTD96 35.0 50. 62. 107. 6.32 0.580 0.964E-06 0.610 0.763 0.899E-06 7.9
The following figures show the sensitivity of the goodness of fit parameter so source depth, the waveform comparison as a function of epicentral distance in degrees and the source to station azimuth
|
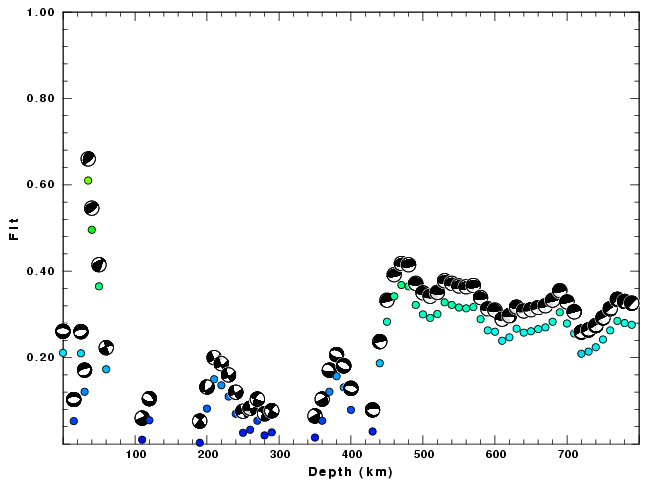
| Goodness of fit as a function of source depth. The measure is 1 - SUM (o -p)2 / SUM o2. A value of 1.0 is the best fit. The best double couple mechanism for the solution depth is plotted above goodness of fit value to indicate how the mefhanism may change with depth. |
|
|
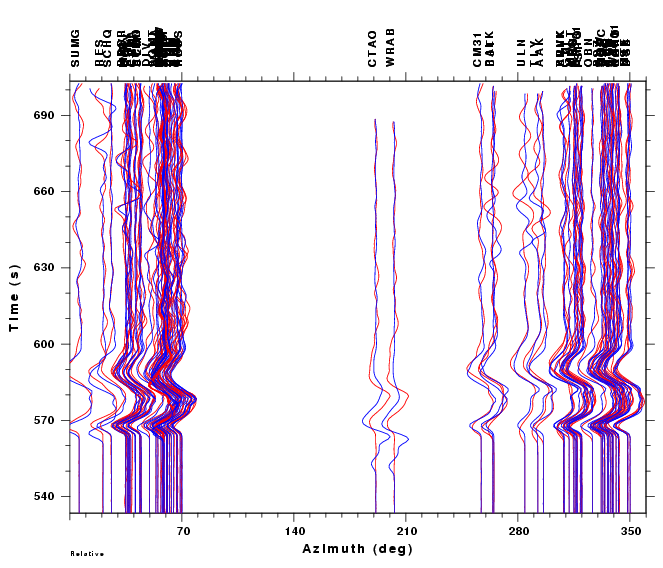
| Comparison of the observed traces (red) and solution predicted traces (blue) as a function of source to station azimuth in degrees (D). The purpose of this display is to highlight the azimuthal dependence on the first motion. The traces are annotated with the station name at the top. |
|
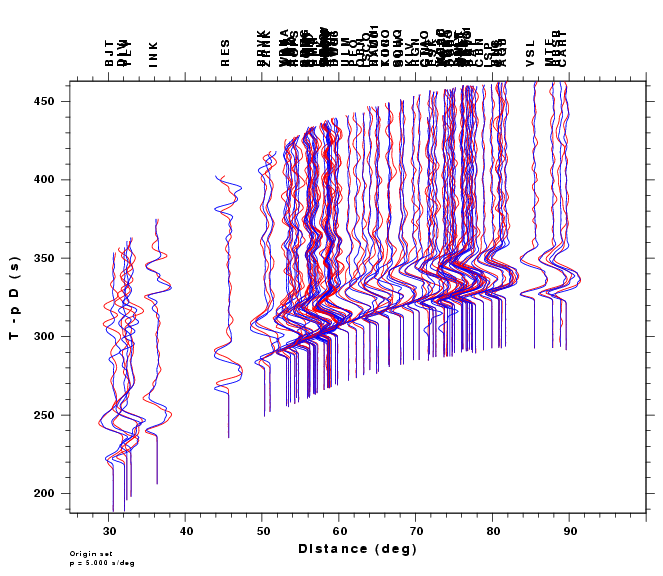
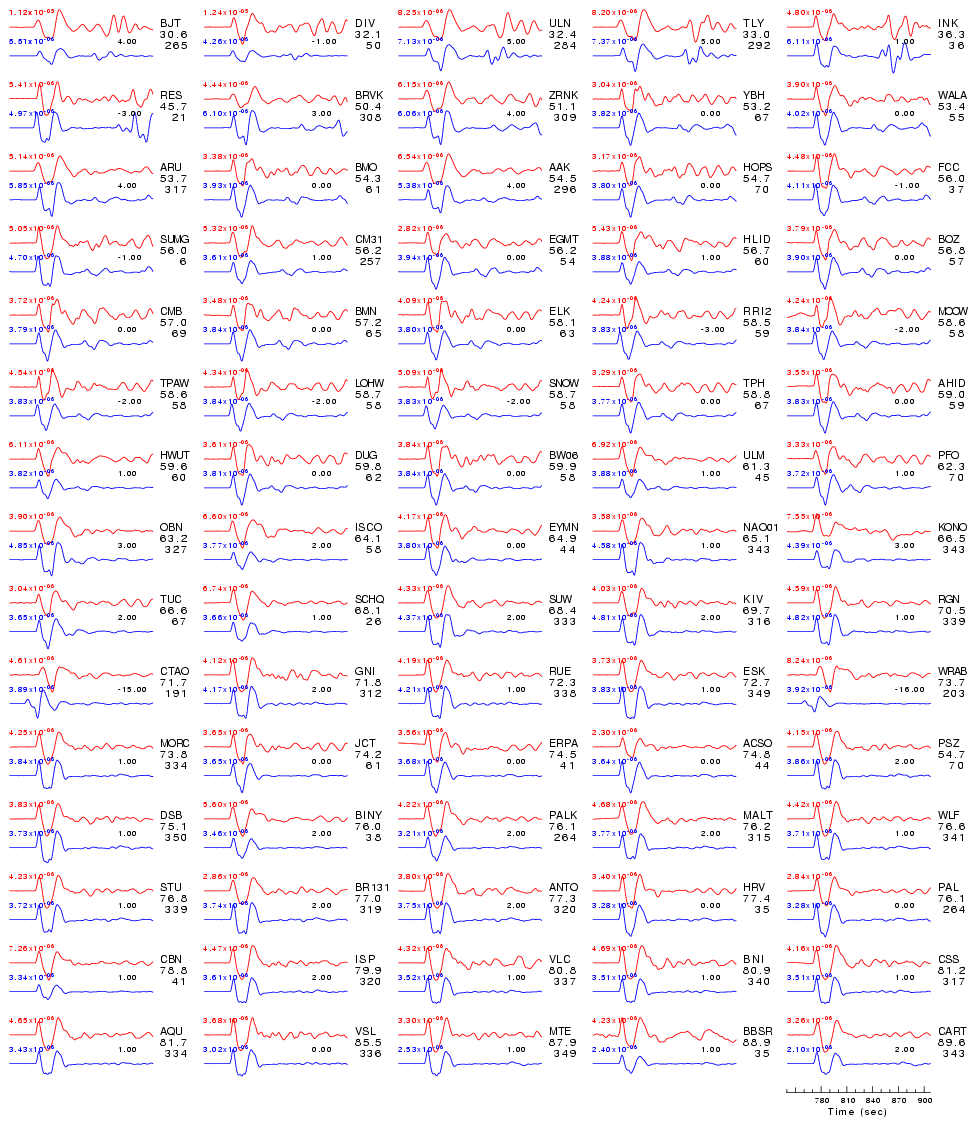
| Comparison of the observed traces (red) and solution predicted traces (blue) ordered in terms of increasing epicentral distance. Each pair of traces is annotated with the station name, epicentral distance in degrees, source to station azimuth in degrees. Each pair of traces is plotted with the same scale and the peak amplitudes are indicated at the lect of each trace. Finally the time shift between the P-wave first arrival picked and the the theoretical P-wave first arrival in the predicted trace is indicated, with a positive sign indicating that the predicted trace has been shifted to the right by the given number of seconds. as a function of source to station azimuth in degrees (D). The purpose of this display is to highlight the azimuthal dependence on the first motion. The traces are annotated with the station name at the top. |