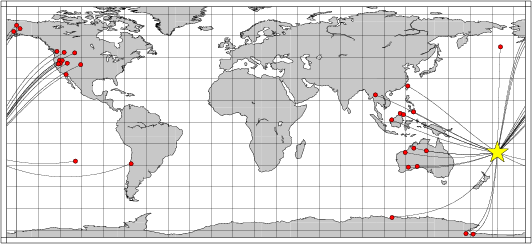
Location of the earthquake (yellow star) and great circle path from the epicenter to each station (red) [created using GMT (Wessel, P., and W. H. F. Smith, New version of Generic Mapping Tools released, EOS Trans. AGU, 76 329, 1995.)]
2006/08/15 23:53:47 -21.17 -176.28 156
The following compares this source inversion to the USGS Rapid Moment Tensor Solution and to the Harvard CMT solutions, if they are available.
Mw=6.2

2006/08/16 23:53:47    EVID:
LAT: 21.17S, LON: 176.28W, DEPTH: 160
Mw: 6.2, mb: 0.0, Ms: 0.0
Mo=  0.240E+26 (dyne-cm)

No. of Stations:  31, GAP:  62
Error (clvd/dc)*100=  44.73
Bandpass:  12 -  60 sec
Nodal plane parameters
      strike     dip    rake
NP1:     358      81    -117
NP2:     251      28     -20

             #######--------
          ###########----------
       ##################---------
     #########--------##########----
    #######-----------#############--
   #####--------------###############-
  #####---------------#################
 ####-----------------##################
 ###-------------------#################
 ##--------------------#################
 ##--------------------#################
 #---------------------#################
 #--------   ----------#########   #####
 #-------- P ----------######### T #####
  --------   ----------#########   ####
   --------------------###############
    -------------------##############
     -----------------##############
       ---------------############
          ------------#########
             --------#######


Stat Dist Az Misfit   Stat Dist Az Misfit
A05A  84  32  0.24    ATKA  73   1  1.04
CASY  64 205  0.90    CHTO  91 289  0.11
COLA  88  11  0.67    COLD  90   9  1.15
DAV   63 289  0.37    EGMT  90  38  0.19
FITZ  54 262  0.21    FORT  50 247 *****
ISCO  89  46  0.18    K06A  81  38  0.21
K08A  82  38  0.15    KKM   71 284  0.13
KMBL  55 245  4.67    KSM   75 277  0.17
LCO   92 122  0.20    LDM   69 284  0.41
MBWA  59 257  0.40    N06A  80  39  0.21
N12A  83  41  0.11    NEW   86  35  0.19
O04C  79  39  0.23    PPLA  85  10  1.11
QSPA  68 180  1.38    RPN   60 109  0.36
SBA   57 184  1.55    SWS   78  48  0.26
TATO  75 304  0.73    VNDA  57 185  2.39
WRAB  46 262  0.69
 Misfit > 1 heavily downweighted
|
06/08/15 23:53:47.22
 FIJI REGION
 Epicenter: -21.172 -176.277
 MW 6.1

 USGS MOMENT TENSOR SOLUTION
 Depth 156         No. of sta: 61
 Moment Tensor;   Scale 10**18 Nm
   Mrr=-0.12       Mtt= 0.34
   Mpp=-0.23       Mrt=-0.17
   Mrp=-1.69       Mtp= 1.14
  Principal axes:
   T  Val=  2.05  Plg=34  Azm=127
   N        0.04      35        9
   P       -2.09      37      248

 Best Double Couple:Mo=2.1*10**18
  NP1:Strike=275 Dip=35 Slip=  -3
  NP2:         8     88      -125

               ######-
          ###########------
        ############---------
      ##############-----------
    #######---------#####--------
   ####-------------########------
   ##---------------###########---
  #----------------#############---
  -----------------###############-
  -----------------################
  ------   --------################
  ------ P -------#######   #######
   -----   -------####### T ######
   ---------------#######   ######
    -------------################
      -----------##############
        ---------############
          -------##########
               -######
|
August 15, 2006, FIJI REGION, MW=6.1

Goran Ekstrom

CENTROID, MOMENT TENSOR SOLUTION
HARVARD EVENT-FILE NAME C081506D
DATA USED: GSN
L.P. BODY WAVES: 74S,180C, T= 40
MANTLE WAVES:    57S, 92C, T=125
CENTROID LOCATION:
ORIGIN TIME       23:53:50.6 0.1
LAT 21.15S 0.01;LON 175.78W 0.01
DEP 163.4 0.5;HALF-DURATION  2.8
MOMENT TENSOR; SCALE 10**25 D-CM
  MRR= 0.02 0.02; MTT= 0.32 0.02
  MPP=-0.34 0.02; MRT=-0.30 0.01
  MRP=-1.76 0.01; MTP= 0.61 0.02
 PRINCIPAL AXES:
 1.(T) VAL=  1.87;PLG=42;AZM=121
 2.(N)       0.09;    21;     10
 3.(P)      -1.96;    41;    261
BEST DOUBLE COUPLE:M0=1.9*10**25
 NP1:STRIKE=283;DIP=21;SLIP=   2
 NP2:STRIKE=191;DIP=89;SLIP= 111

            ########---
        ############-------
      ####----------###------
    ###------------########----
   #---------------##########---
  #----------------###########---
  ----------------##############-
 -----------------##############--
 -----   ---------###############-
 ----- P --------################-
 -----   --------#######   #######
  --------------######## T ######
  --------------########   ######
   -------------################
    -----------################
      ---------##############
        -------############
            ---########
|
The following broadband stations were used for the source inversion: A05A ATKA CASY CHTO COLA COLD DAV EGMT FITZ FORT ISCO K06A K08A KKM KMBL KSM LCO LDM MBWA N06A N12A NEW O04C PPLA QSPA RPN SBA SWS TATO VNDA WRAB
|
Location of the earthquake (yellow star) and great circle path from the epicenter to each station (red) [created using GMT (Wessel, P., and W. H. F. Smith, New version of Generic Mapping Tools released, EOS Trans. AGU, 76 329, 1995.)] |
All observed and Greens function waveforms are corrected to instrument response to ground velocity in meters/sec for the passband of 0.01 - 5 Hz. Next tre traces were bandpass filtered by the application of the following high- and low-pass stages:
hp c 0.0167 2
lp c 0.0833 2
int
br c 0.12 0.25 n 4 p 2
The traces were next integrated to ground displacment in meters. Finally waveforms were cut from 30 seconds before to 140 seconds after the P arrival so that the direct P wave, pP and perhaps the sP are included.
The source inversion is a multipass operation since a lower frequency filter band is used for larger earthquakes and since a search is made over depth. Up to three passed of the outer loop are made, after which the moment magnitude is determined and filter settings readjusted. The inner loop over depth samples all depths from 0 to 800 km with 5 km increments in depth to 50 km, followed by 10 km depth sampling for the remaining range.
The following filter ranges are used according to the moment magnitude Mw:
   FILTER_BAND   FH(s)  FL(s)
       1           60     12      Mw < 6.4
       2          100     20      6.4 < Mw <= 6.9
       3          120     40      Mw > 6.9
For this data set the favored solution is
WVFMTD96 160.0 358. 81. -117. 6.22 0.470 0.273E-06 0.673 0.720 0.155E-06 44.7
The following figures show the sensitivity of the goodness of fit parameter so source depth, the waveform comparison as a function of epicentral distance in degrees and the source to station azimuth
|
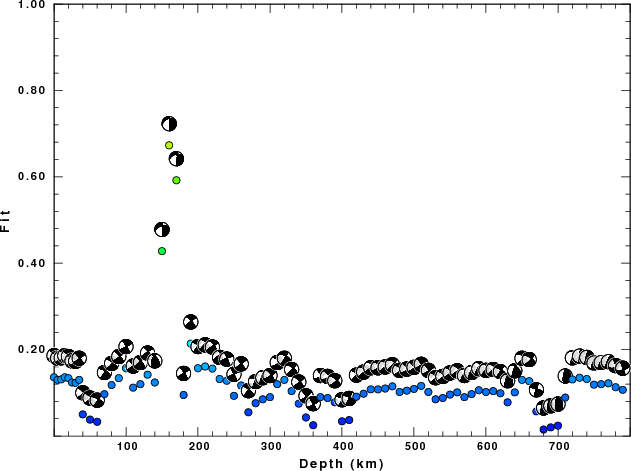
| Goodness of fit as a function of source depth. The measure is 1 - SUM (o -p)2 / SUM o2. A value of 1.0 is the best fit. The best double couple mechanism for the solution depth is plotted above goodness of fit value to indicate how the mefhanism may change with depth. |
|
|
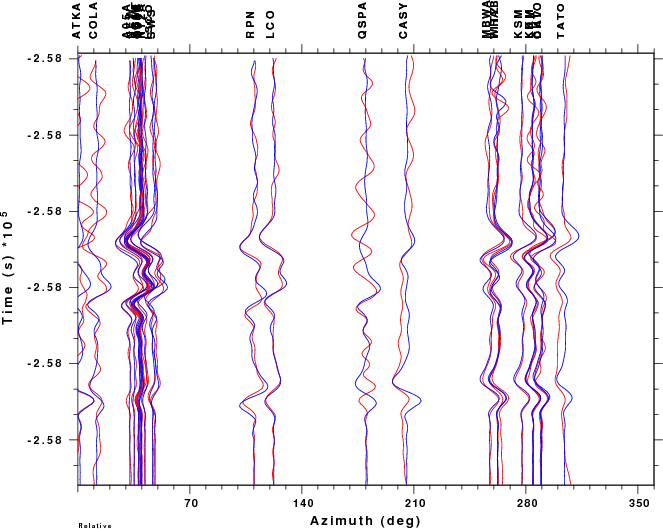
| Comparison of the observed traces (red) and solution predicted traces (blue) as a function of source to station azimuth in degrees (D). The purpose of this display is to highlight the azimuthal dependence on the first motion. The traces are annotated with the station name at the top. |
|
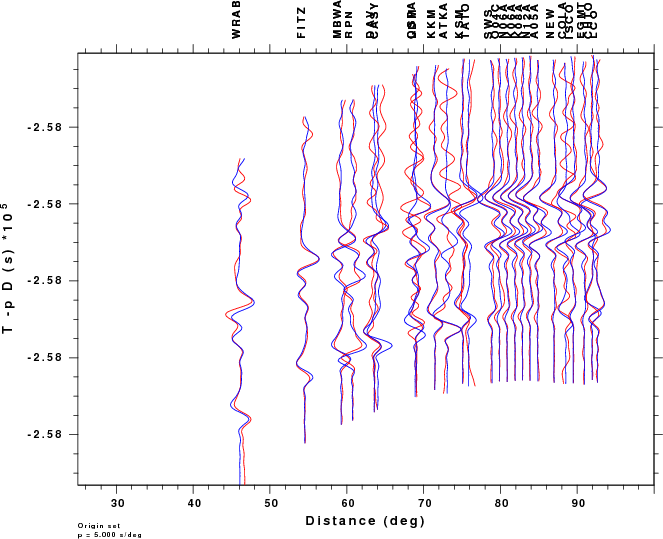
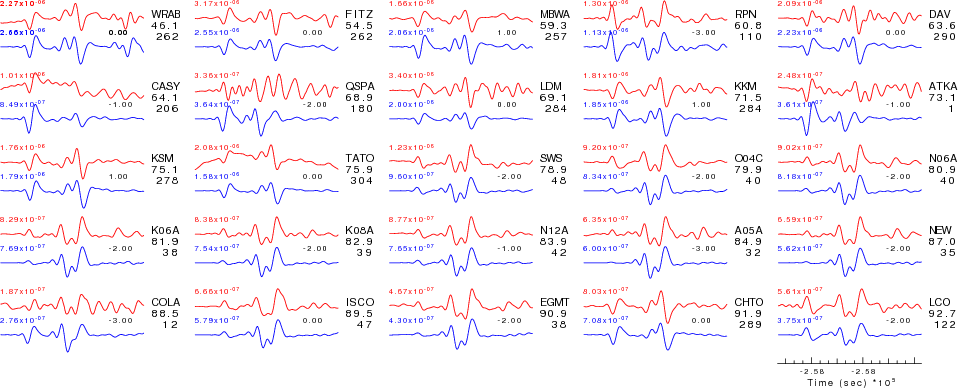
| Comparison of the observed traces (red) and solution predicted traces (blue) ordered in terms of increasing epicentral distance. Each pair of traces is annotated with the station name, epicentral distance in degrees, source to station azimuth in degrees. Each pair of traces is plotted with the same scale and the peak amplitudes are indicated at the lect of each trace. Finally the time shift between the P-wave first arrival picked and the the theoretical P-wave first arrival in the predicted trace is indicated, with a positive sign indicating that the predicted trace has been shifted to the right by the given number of seconds. as a function of source to station azimuth in degrees (D). The purpose of this display is to highlight the azimuthal dependence on the first motion. The traces are annotated with the station name at the top. |