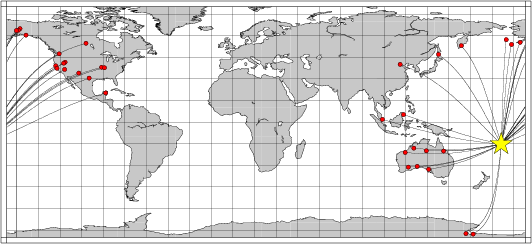
Location of the earthquake (yellow star) and great circle path from the epicenter to each station (red) [created using GMT (Wessel, P., and W. H. F. Smith, New version of Generic Mapping Tools released, EOS Trans. AGU, 76 329, 1995.)]
2006/07/07 07:26:12 -15.26 -173.60 35
The following compares this source inversion to the USGS Rapid Moment Tensor Solution and to the Harvard CMT solutions, if they are available.
Mw=5.9

2006/07/07 07:26:12    EVID:
LAT: 15.26S, LON: 173.60W, DEPTH:  35
Mw: 5.9, mb: 0.0, Ms: 0.0
Mo=  0.717E+25 (dyne-cm)

No. of Stations:  33, GAP: 115
Error (clvd/dc)*100=  34.18
Bandpass:  12 -  60 sec
Nodal plane parameters
      strike     dip    rake
NP1:      95      87     -83
NP2:     212       7    -153

             ###-----------#
          ##-------------------
       ##-------------------------
     ##-----------------------------
    ##---------------   -------------
   #----------------- P --------------
  ##-----------------   ---------------
 ##-------------------------------------
 #--------------------------------------
 #--------------------------------------
 -##########----------------------------
 -######################################
 -######################################
 -######################################
  -####################################
   -###############   ################
    -############## T ###############
     -#############   ##############
       -##########################
          #####################
             ###############


Stat Dist Az Misfit   Stat Dist Az Misfit
BBOO  48 239  0.61    BERG  79  14  0.37
BJT   85 313  0.71    CCM   93  51  0.44
COLA  82  10  0.42    CTAO  38 256  0.93
FFC   92  33  0.42    FITZ  58 257  0.84
FORT  55 242  7.41    FUR   74  44  0.44
HOPS  71  39  0.36    JCT   84  56  3.08
JRSC  71  41  0.35    KMBL  60 242  0.65
KOM   83 273  0.89    LDM   70 281  0.78
LTY   78  33  0.71    M10A  77  40  0.44
MBWA  63 253  0.80    MCK   81  10  0.34
N09A  76  40  0.45    PET   72 342  0.39
SBA   63 184  0.69    SDPT  71   7  0.38
SIUC  94  52  0.73    SPIA  72   1  0.44
TEIG  90  69  0.73    TRF   80  10  0.54
UNV   69   4  0.53    VNDA  63 185  0.68
WRAB  49 256  0.73    Y22C  80  50  0.48
YSS   73 330  0.50
 Misfit > 1 heavily downweighted
|
 06/07/07 07:26:12.31
 TONGA
 Epicenter: -15.258 -173.605
 MW 6.0

 USGS MOMENT TENSOR SOLUTION
 Depth  34         No. of sta: 66
 Moment Tensor;   Scale 10**18 Nm
   Mrr= 0.05       Mtt=-0.09
   Mpp= 0.04       Mrt=-1.06
   Mrp= 0.27       Mtp= 0.03
  Principal axes:
   T  Val=  1.07  Plg=47  Azm=195
   N        0.04       0      104
   P       -1.11      43       14

 Best Double Couple:Mo=1.1*10**18
  NP1:Strike= 96 Dip= 2 Slip=  81
  NP2:       284     88        90

               -------
          -----------------
        ---------------------
      -------------   ---------
    --------------- P -----------
   ----------------   ------------
   -------------------------------
  ##-------------------------------
  ##########-----------------------
  ##################---------------
  #########################--------
  ###############################--
   ############   ################
   ############ T ################
    -##########   ##############-
      #########################
        #####################
          -###############-
               -------
|
July 7, 2006, TONGA, MW=6.0

Goran Ekstrom

CENTROID, MOMENT TENSOR SOLUTION
HARVARD EVENT-FILE NAME C070706A
DATA USED: GSN
L.P. BODY WAVES: 78S,178C, T= 40
MANTLE WAVES:    55S, 68C, T=125
CENTROID LOCATION:
ORIGIN TIME       07:26:18.4 0.1
LAT 15.07S 0.01;LON 173.49W 0.01
DEP  57.7 1.6;HALF-DURATION  2.5
MOMENT TENSOR; SCALE 10**25 D-CM
  MRR=-0.09 0.01; MTT= 0.19 0.02
  MPP=-0.10 0.02; MRT=-1.17 0.02
  MRP= 0.11 0.01; MTP= 0.06 0.01
 PRINCIPAL AXES:
 1.(T) VAL=  1.23;PLG=42;AZM=182
 2.(N)      -0.08;     4;    276
 3.(P)      -1.14;    48;     10
BEST DOUBLE COUPLE:M0=1.2*10**25
 NP1:STRIKE=222;DIP= 6;SLIP=-143
 NP2:STRIKE= 96;DIP=87;SLIP= -86

            ###-------#
        ##----------------#
      #----------------------
    #-------------   ----------
   #-------------- P -----------
  #---------------   ------------
  -------------------------------
 #--------------------------------
 -###-----------------------------
 -##################--------------
 -################################
  ###############################
  -##############################
   #############   #############
    -########### T ############
      ##########   ##########
        ###################
            ###########
|
The following broadband stations were used for the source inversion: BBOO BERG BJT CCM COLA CTAO FFC FITZ FORT FUR HOPS JCT JRSC KMBL KOM LDM LTY M10A MBWA MCK N09A PET SBA SDPT SIUC SPIA TEIG TRF UNV VNDA WRAB Y22C YSS
|
Location of the earthquake (yellow star) and great circle path from the epicenter to each station (red) [created using GMT (Wessel, P., and W. H. F. Smith, New version of Generic Mapping Tools released, EOS Trans. AGU, 76 329, 1995.)] |
All observed and Greens function waveforms are corrected to instrument response to ground velocity in meters/sec for the passband of 0.01 - 5 Hz. Next tre traces were bandpass filtered by the application of the following high- and low-pass stages:
hp c 0.0167 2
lp c 0.0833 2
int
The traces were next integrated to ground displacment in meters. Finally waveforms were cut from 30 seconds before to 140 seconds after the P arrival so that the direct P wave, pP and perhaps the sP are included.
The source inversion is a multipass operation since a lower frequency filter band is used for larger earthquakes and since a search is made over depth. Up to three passed of the outer loop are made, after which the moment magnitude is determined and filter settings readjusted. The inner loop over depth samples all depths from 0 to 800 km with 5 km increments in depth to 50 km, followed by 10 km depth sampling for the remaining range.
The following filter ranges are used according to the moment magnitude Mw:
   FILTER_BAND   FH(s)  FL(s)
       1           60     12      Mw < 6.4
       2          100     20      6.4 < Mw <= 6.9
       3          120     40      Mw > 6.9
For this data set the favored solution is
WVFMTD96 35.0 95. 87. -83. 5.87 0.380 0.232E-06 0.470 0.617 0.142E-06 34.2
The following figures show the sensitivity of the goodness of fit parameter so source depth, the waveform comparison as a function of epicentral distance in degrees and the source to station azimuth
|
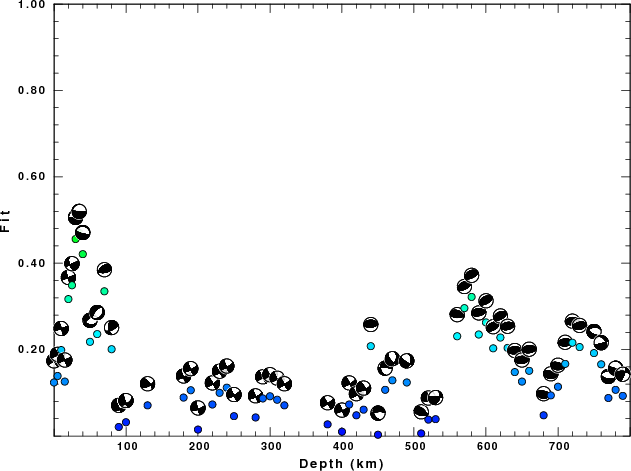
| Goodness of fit as a function of source depth. The measure is 1 - SUM (o -p)2 / SUM o2. A value of 1.0 is the best fit. The best double couple mechanism for the solution depth is plotted above goodness of fit value to indicate how the mefhanism may change with depth. |
|
|
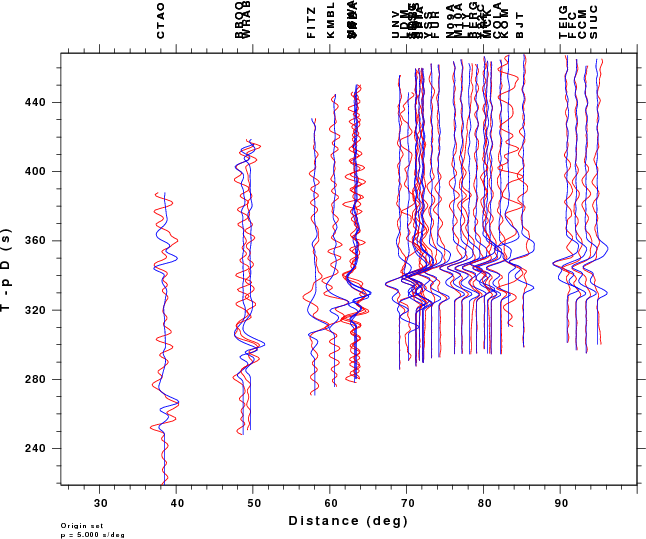
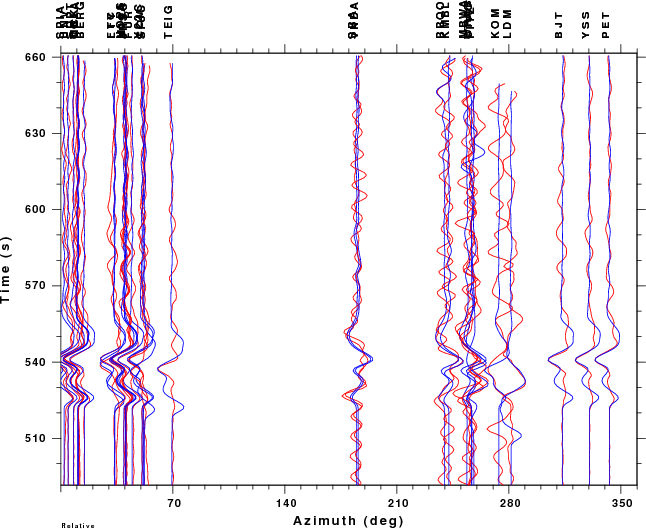
| Comparison of the observed traces (red) and solution predicted traces (blue) as a function of source to station azimuth in degrees (D). The purpose of this display is to highlight the azimuthal dependence on the first motion. The traces are annotated with the station name at the top. |