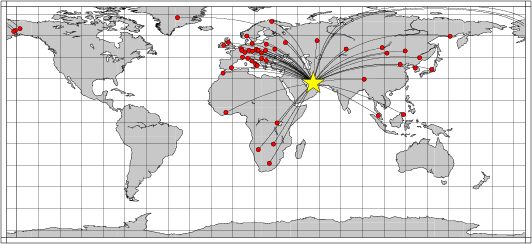
Location of the earthquake (yellow star) and great circle path from the epicenter to each station (red) [created using GMT (Wessel, P., and W. H. F. Smith, New version of Generic Mapping Tools released, EOS Trans. AGU, 76 329, 1995.)]
2006/06/28 21:02:09 26.97 55.84 10
The following compares this source inversion to the USGS Rapid Moment Tensor Solution and to the Harvard CMT solutions, if they are available.
Mw=5.7

2006/06/28 21:02:09    EVID:
LAT: 26.97N, LON:  55.84E, DEPTH:  15
Mw: 5.7, mb: 0.0, Ms: 0.0
Mo=  0.431E+25 (dyne-cm)

No. of Stations:  48, GAP: 101
Error (clvd/dc)*100=  54.04
Bandpass:  12 -  60 sec
Nodal plane parameters
      strike     dip    rake
NP1:      28      62      41
NP2:     276      55     145

             ---------------
          --------------------#
       ------------------------###
     --------------------------#####
    ---------------------------######
   ----------------------------#######
  -------##################---#########
 ----#########################--########
 -###########################------#####
 ############################--------###
 ###########################-----------#
 #########   ##############-------------
 ######### T #############--------------
 #########   ############---------------
  ######################---------------
   ####################---------------
    #################----------------
     ##############-----------------
       ##########-----------   ---
          ####-------------- P
             ---------------


Stat Dist Az Misfit   Stat Dist Az Misfit
AQU   37 305  0.39    ARU   29   3  0.46
BFO   42 313  0.55    BJT   51  59  0.70
BNI   42 308  0.65    BOSA  62 210  0.73
CART  48 297  0.57    COLA  86   9  0.75
CUC   35 301  0.56    DBIC  60 262  0.54
DIVS  33 310  0.91    DPC   38 318  0.41
DSB   52 317  0.64    ESK   50 320  0.79
GRFO  40 315  0.32    HGN   44 316  0.37
HIA   53  47  0.72    INCN  59  60  0.65
IPM   48 109  0.79    KEV   45 346  0.59
KHC   39 315  0.77    KIEV  31 326  0.63
KONO  45 328  0.55    KTH   87  11  0.59
KURK  29  30  0.70    KWP   34 320  0.82
LDM   63  98  0.68    LSA   31  76  0.78
LSZ   49 215  1.09    MA2   69  32  0.63
MAJO  68  58  0.60    MBAR  36 225  1.26
MDJ   60  52  0.91    MORC  37 318  0.67
OBN   31 338  0.49    PPLA  87  12  0.49
PSZ   34 316  0.74    RGN   41 323  0.33
RTC   53 293  0.54    SUMG  65 340  0.53
SUW   36 327  0.56    TIP   34 300  0.95
TLY   43  42  0.67    TSUM  59 223  0.72
ULN   44  48  0.84    VLC   40 307  0.65
VTS   30 308  0.51    WLF   44 314  0.20
 Misfit > 1 heavily downweighted
|
 06/06/28 21:02:16.18
 SOUTHERN IRAN
 Epicenter:  26.999   55.795
 MW 5.7

 USGS MOMENT TENSOR SOLUTION
 Depth   5         No. of sta: 32
 Moment Tensor;   Scale 10**17 Nm
   Mrr= 4.77       Mtt=-0.93
   Mpp=-3.84       Mrt= 0.74
   Mrp= 2.10       Mtp=-1.94
  Principal axes:
   T  Val=  5.27  Plg=77  Azm=283
   N        0.02       3       25
   P       -5.29      12      116

 Best Double Couple:Mo=5.3*10**17
  NP1:Strike=210 Dip=33 Slip=  95
  NP2:        24     57        87

               -------
          -------------####
        ---------#########---
      --------############-----
    --------###############------
   -------################--------
   ------#################--------
  ------##################---------
  ------#######   ########---------
  -----######## T #######----------
  -----########   ######-----------
  -----#################------   --
   ----################------- P -
   ----##############---------   -
    ---#############-------------
      --##########-------------
        -#######-------------
          ###--------------
               -------
|
June 28, 2006, SOUTHERN IRAN, MW=5.8

Goran Ekstrom

CENTROID, MOMENT TENSOR SOLUTION
HARVARD EVENT-FILE NAME C062806A
DATA USED: GSN
L.P. BODY WAVES: 71S,141C, T= 40
SURFACE WAVES:   79S,177C, T= 50
CENTROID LOCATION:
ORIGIN TIME       21:02:13.5 0.1
LAT 26.80N 0.01;LON  55.82E 0.01
DEP  12.0 FIX;HALF-DURATION  2.0
MOMENT TENSOR; SCALE 10**24 D-CM
  MRR= 5.13 0.06; MTT=-4.41 0.06
  MPP=-0.73 0.06; MRT= 2.54 0.16
  MRP= 2.11 0.16; MTP=-3.12 0.05
 PRINCIPAL AXES:
 1.(T) VAL=  6.06;PLG=74;AZM=307
 2.(N)       1.00;     6;     58
 3.(P)      -7.06;    15;    149
BEST DOUBLE COUPLE:M0=6.6*10**24
 NP1:STRIKE=248;DIP=30;SLIP= 102
 NP2:STRIKE= 54;DIP=60;SLIP=  83

            -----------
        -------------------
      -----------######------
    --------################---
   ------#######################
  -----#######################---
  ---########   #############----
 ---######### T ############------
 --##########   ###########-------
 --#######################--------
 -######################----------
  ###################------------
  #################--------------
   ############-----------------
    -------------------   -----
      ----------------- P ---
        ---------------   -
            -----------
|
The following broadband stations were used for the source inversion: AQU ARU BFO BJT BNI BOSA CART COLA CUC DBIC DIVS DPC DSB ESK GRFO HGN HIA INCN IPM KEV KHC KIEV KONO KTH KURK KWP LDM LSA LSZ MA2 MAJO MBAR MDJ MORC OBN PPLA PSZ RGN RTC SUMG SUW TIP TLY TSUM ULN VLC VTS WLF
|
Location of the earthquake (yellow star) and great circle path from the epicenter to each station (red) [created using GMT (Wessel, P., and W. H. F. Smith, New version of Generic Mapping Tools released, EOS Trans. AGU, 76 329, 1995.)] |
All observed and Greens function waveforms are corrected to instrument response to ground velocity in meters/sec for the passband of 0.01 - 5 Hz. Next tre traces were bandpass filtered by the application of the following high- and low-pass stages:
hp c 0.0167 2
lp c 0.0833 2
int
The traces were next integrated to ground displacment in meters. Finally waveforms were cut from 30 seconds before to 140 seconds after the P arrival so that the direct P wave, pP and perhaps the sP are included.
The source inversion is a multipass operation since a lower frequency filter band is used for larger earthquakes and since a search is made over depth. Up to three passed of the outer loop are made, after which the moment magnitude is determined and filter settings readjusted. The inner loop over depth samples all depths from 0 to 800 km with 5 km increments in depth to 50 km, followed by 10 km depth sampling for the remaining range.
The following filter ranges are used according to the moment magnitude Mw:
   FILTER_BAND   FH(s)  FL(s)
       1           60     12      Mw < 6.4
       2          100     20      6.4 < Mw <= 6.9
       3          120     40      Mw > 6.9
For this data set the favored solution is
WVFMTD96 15.0 28. 62. 41. 5.72 0.306 0.255E-06 0.333 0.554 0.218E-06 54.0
The following figures show the sensitivity of the goodness of fit parameter so source depth, the waveform comparison as a function of epicentral distance in degrees and the source to station azimuth
|
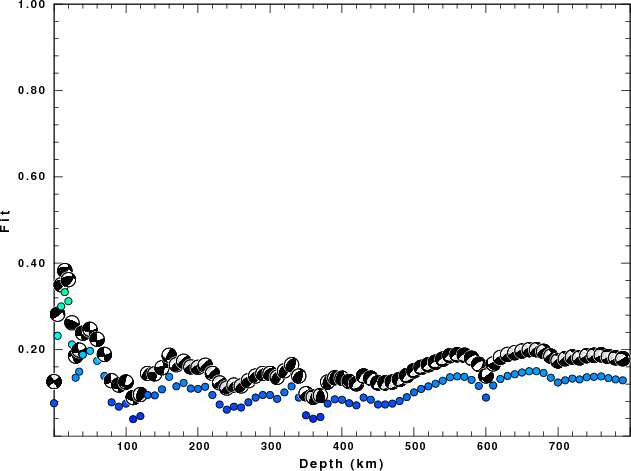
| Goodness of fit as a function of source depth. The measure is 1 - SUM (o -p)2 / SUM o2. A value of 1.0 is the best fit. The best double couple mechanism for the solution depth is plotted above goodness of fit value to indicate how the mefhanism may change with depth. |
|
|
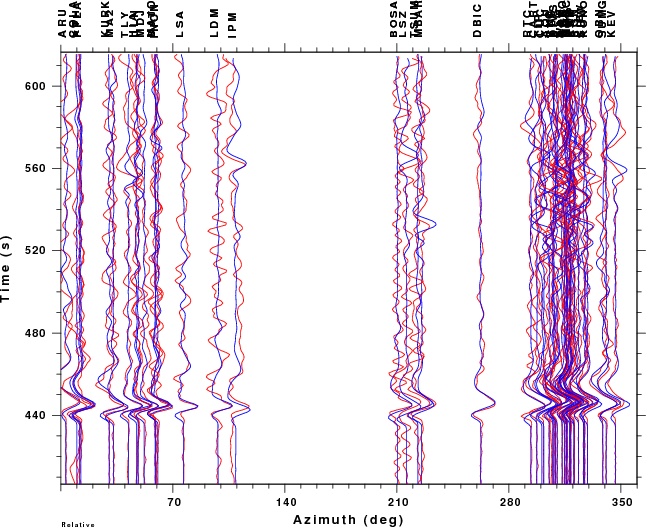
| Comparison of the observed traces (red) and solution predicted traces (blue) as a function of source to station azimuth in degrees (D). The purpose of this display is to highlight the azimuthal dependence on the first motion. The traces are annotated with the station name at the top. |
|
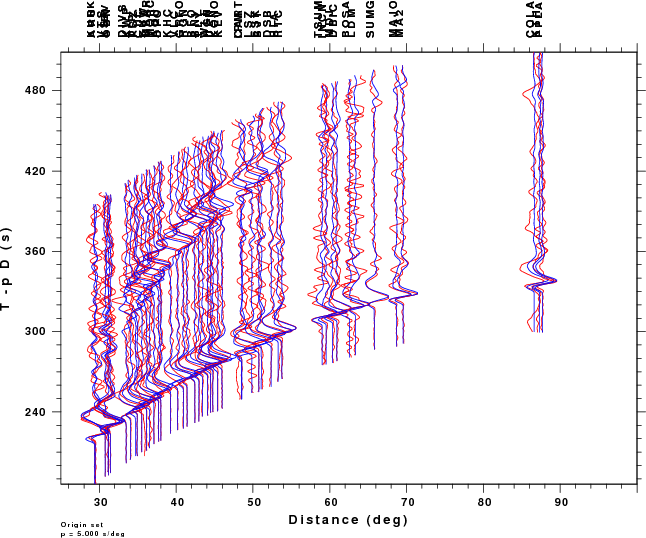
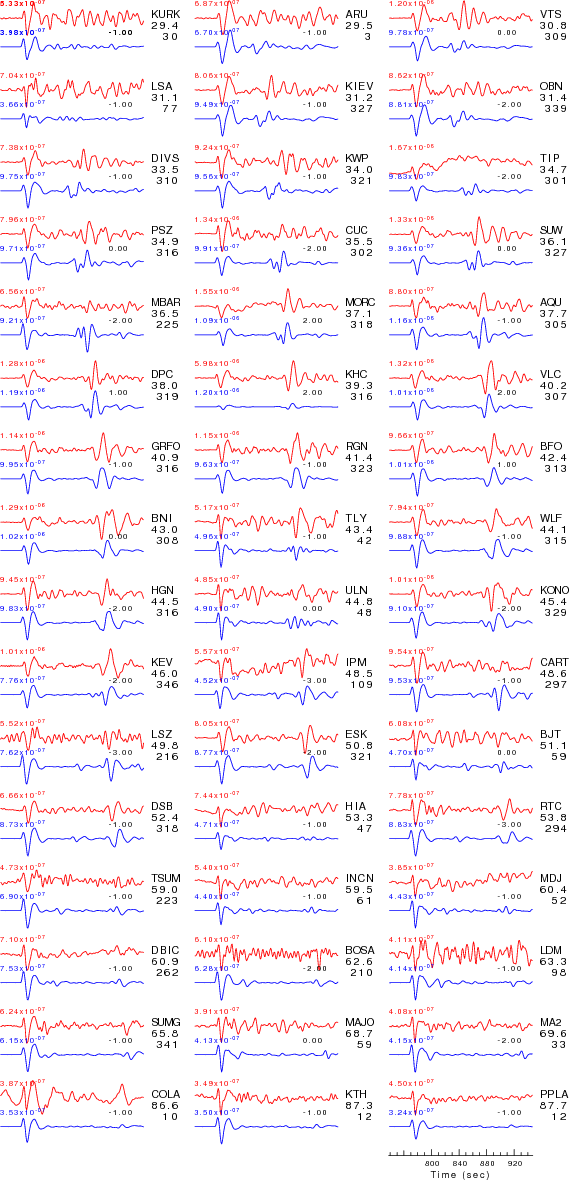
| Comparison of observed (red) and predicted waveforms in order of increasing distance. For each station, the same plotting scale is used so that amplitudes can be compared. The maximum value of the bandpassfiltered ground velocity is indicated in units of meters/sec. The station name, epicentral distance in degrees and source-to-station azimuth are given. The time shift indicates the number of seconds that the predicted trace was shifted to match the observed. |