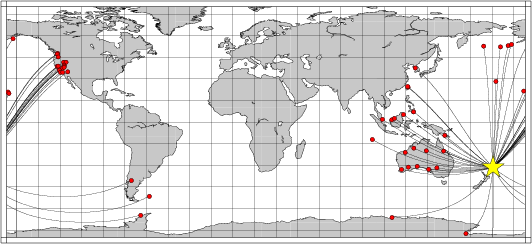
Location of the earthquake (yellow star) and great circle path from the epicenter to each station (red) [created using GMT (Wessel, P., and W. H. F. Smith, New version of Generic Mapping Tools released, EOS Trans. AGU, 76 329, 1995.)]
2006/05/16 10:39:23 -31.56 -179.30 148
The following compares this source inversion to the USGS Rapid Moment Tensor Solution and to the Harvard CMT solutions, if they are available.
Mw=7.5

2006/05/16 10:39:23    EVID:
LAT: 31.56S, LON: 179.30W, DEPTH: 160
Mw: 7.5, mb: 0.0, Ms: 0.0
Mo=  0.175E+28 (dyne-cm)

No. of Stations:  49, GAP:  85
Error (clvd/dc)*100=  37.09
Bandpass:  40 - 100 sec
Nodal plane parameters
      strike     dip    rake
NP1:      13      76     103
NP2:     150      19      48

             ############---
          ###############------
       -##################--------
     --###################----------
    --####################-----------
   --####################-------------
  --#####################--------------
 ---########   ##########---------------
 ---######## T ##########---------------
 ---########   #########---------   ----
 ---####################--------- P ----
 ---####################---------   ----
 ---###################-----------------
 ----##################-----------------
  ----################-----------------
   ----##############-----------------
    ----#############----------------
     -----##########----------------
       -----#######---------------
          ------##-------------
             ----###########


Stat Dist Az Misfit   Stat Dist Az Misfit
ATKA  83   3  0.40    BBOO  37 255  0.40
C05A  94  34  0.55    CASY  53 208  0.71
COCO  78 262  0.09    CTAO  32 281  0.08
D05A  93  35  0.58    DAV   65 296  0.85
EFI   82 147  0.21    FITZ  51 271  0.38
FORT  44 256 51.92    G05A  92  36  0.54
INCN  85 319  0.20    KDAK  91  13  0.59
KIP   56  23  0.47    KMBL  49 253  0.97
KOM   79 278  0.07    KSM   74 281  0.10
LDM   69 289  0.11    M09A  92  41  0.48
M11A  93  42  0.51    MAUI  56  26  0.54
MBWA  55 265  0.09    MIDW  59   1  0.58
NACB  79 307  0.14    NEE   89  48  0.42
NIKO  84   6  0.46    NWAO  52 250  0.13
P09A  91  43  0.50    PKD   86  44  0.45
PLCA  82 133  0.16    PMG   38 297  0.07
PMSA  71 155  0.52    POHA  55  27  0.52
Q03C  87  41  0.46    Q04C  88  41  0.47
Q09A  90  43  0.50    QSPA  58 180  0.86
S08C  89  44  0.45    SBC   86  45  0.39
SBM   73 283  0.08    SMY   84 355  0.42
STKA  33 258  0.03    TPH   90  44  0.44
UNV   85   7  0.47    VCS   87  46  0.43
VNDA  46 185  1.17    WRAB  43 274  0.06
YHNB  79 307  0.59
 Misfit > 1 heavily downweighted
|
Mw=7.3 KERMADEC ISLANDS REGION

2006/05/16 10:39:23.55    EVID: MUAH
LAT: 31.56S, LON: 179.30W, DEPTH: 160
Mw: 7.3, mb: 7.4, Ms: 7.4
Mo=  0.109E+28 (dyne-cm)

No. of Stations:  15, GAP: 199
Error (clvd/dc)*100=  71.40

Nodal plane parameters
      strike     dip    rake
NP1:     265      59     124
NP2:      32      45      47

                ----------
           --------------------
        ------------------------##
      ---------------------------###
     -----------------------------###
    ------------------------------####
   -------------------------------#####
  ------------##################--######
  -------#########################---###
 -----############################------#
 --##############################--------
 -###############################--------
 ###############################---------
  #############################---------
  ############################----------
   ##########################----------
    #######################-----------
     ####################------------
      ################--------------
        ###########---------------
           --------------------
                ----------

Stat Dist Az Misfit   Stat Dist Az Misfit
CHTO  92 290  0.33    CMB   88  42  0.26
COCO  78 262  0.26    COR   91  36  0.34
CTAO  32 281  0.88    DAV   65 296  0.35
HNR   29 314  0.85    INCN  85 319  0.55
MAJO  78 326  0.55    MOD   91  39  0.39
NWAO  52 250  0.14    TATO  79 307  0.33
TUC   90  51  0.22    WDC   88  39  0.35
YSS   85 334  0.63

Median of misfit:  0.35
  Average misfit:  0.43
|
Natasha Maternovskaya

CENTROID, MOMENT TENSOR SOLUTION
HARVARD EVENT-FILE NAME C051606A
DATA USED: GSN
L.P. BODY WAVES: 80S,229C, T= 50
MANTLE WAVES:    79S,221C, T=150
CENTROID LOCATION:
ORIGIN TIME       10:39:36.8 0.1
LAT 31.31S 0.01;LON 178.92W 0.01
DEP 154.6 1.0;HALF-DURATION 12.6
MOMENT TENSOR; SCALE 10**27 D-CM
  MRR= 1.01 0.01; MTT=-0.49 0.01
  MPP=-0.53 0.01; MRT=-0.24 0.01
  MRP= 1.38 0.01; MTP= 0.38 0.01
 PRINCIPAL AXES:
 1.(T) VAL=  1.82;PLG=60;AZM=269
 2.(N)      -0.30;    11;    160
 3.(P)      -1.53;    28;     64
BEST DOUBLE COUPLE:M0=1.7*10**27
 NP1:STRIKE=126;DIP=20;SLIP=  55
 NP2:STRIKE=343;DIP=74;SLIP= 102

            #----------
        ######-------------
      ##########-------------
    #############--------------
   -##############--------------
  -################--------   ---
  -################-------- P ---
 --#################-------   ----
 --#######   ########-------------
 --####### T ########-------------
 ---######   #########------------
  --##################-----------
  ---#################-----------
   ----################---------
    -----##############-------#
      -----############-----#
        --------###########
            ----------#
|
The following broadband stations were used for the source inversion: ATKA BBOO C05A CASY COCO CTAO D05A DAV EFI FITZ FORT G05A INCN KDAK KIP KMBL KOM KSM LDM M09A M11A MAUI MBWA MIDW NACB NEE NIKO NWAO P09A PKD PLCA PMG PMSA POHA Q03C Q04C Q09A QSPA S08C SBC SBM SMY STKA TPH UNV VCS VNDA WRAB YHNB
|
Location of the earthquake (yellow star) and great circle path from the epicenter to each station (red) [created using GMT (Wessel, P., and W. H. F. Smith, New version of Generic Mapping Tools released, EOS Trans. AGU, 76 329, 1995.)] |
All observed and Greens function waveforms are corrected to instrument response to ground velocity in meters/sec for the passband of 0.01 - 5 Hz. Next tre traces were bandpass filtered by the application of the following high- and low-pass stages:
hp c 0.0083 2
lp c 0.0250 2
The traces were next integrated to ground displacment in meters. Finally waveforms were cut from 30 seconds before to 140 seconds after the P arrival so that the direct P wave, pP and perhaps the sP are included.
The source inversion is a multipass operation since a lower frequency filter band is used for larger earthquakes and since a search is made over depth. Up to three passed of the outer loop are made, after which the moment magnitude is determined and filter settings readjusted. The inner loop over depth samples all depths from 0 to 800 km with 5 km increments in depth to 50 km, followed by 10 km depth sampling for the remaining range.
The following filter ranges are used according to the moment magnitude Mw:
   FILTER_BAND   FH(s)  FL(s)
       1           60     12      Mw < 6.4
       2          100     20      6.4 < Mw <= 6.9
       3          120     40      Mw > 6.9
For this data set the favored solution is
WVFMTD96 160.0 13. 76. 103. 7.46 0.654 0.141E-04 0.672 0.809 0.121E-04 37.1
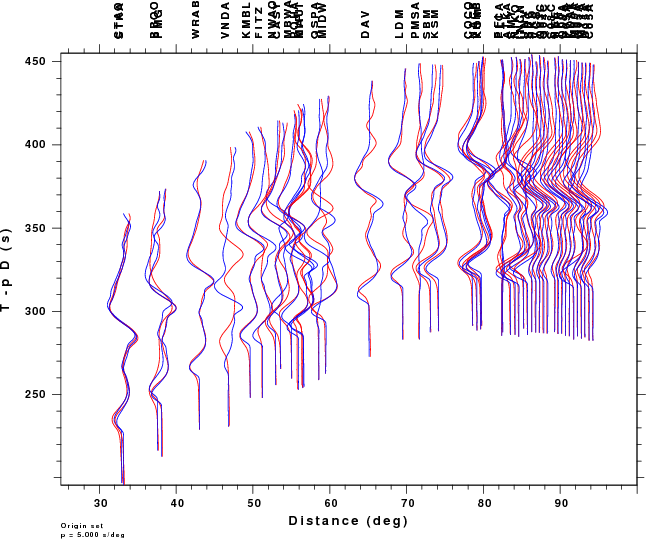
The following figures show the sensitivity of the goodness of fit parameter so source depth, the waveform comparison as a function of epicentral distance in degrees and the source to station azimuth
|
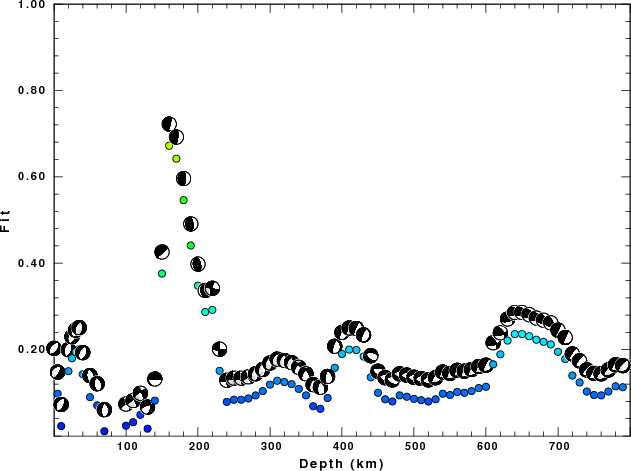
| Goodness of fit as a function of source depth. The measure is 1 - SUM (o -p)2 / SUM o2. A value of 1.0 is the best fit. The best double couple mechanism for the solution depth is plotted above goodness of fit value to indicate how the mefhanism may change with depth. |
|
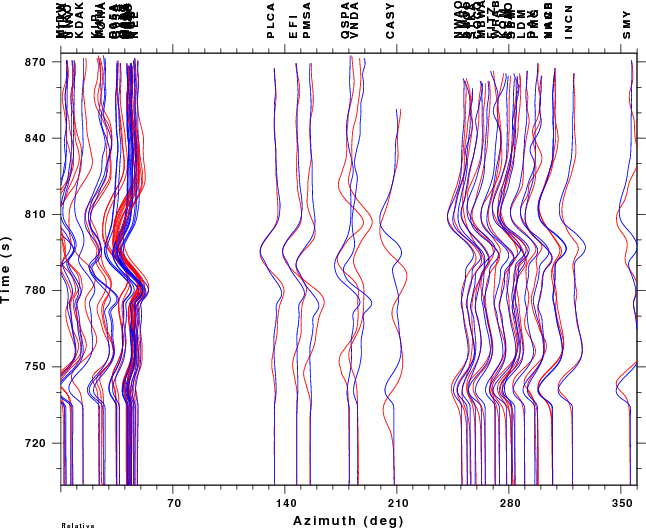
|
| Comparison of the observed traces (red) and solution predicted traces (blue) as a function of source to station azimuth in degrees (D). The purpose of this display is to highlight the azimuthal dependence on the first motion. The traces are annotated with the station name at the top. |