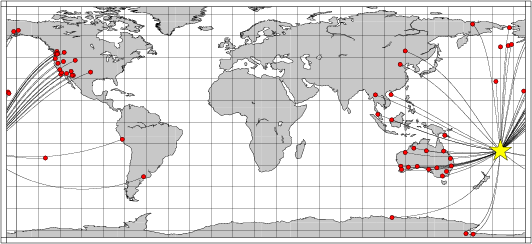
Location of the earthquake (yellow star) and great circle path from the epicenter to each station (red) [created using GMT (Wessel, P., and W. H. F. Smith, New version of Generic Mapping Tools released, EOS Trans. AGU, 76 329, 1995.)]
2006/05/03 15:26:35 -20.04 -174.23 16
The following compares this source inversion to the USGS Rapid Moment Tensor Solution and to the Harvard CMT solutions, if they are available.
Mw=7.8

2006/05/03 15:26:35    EVID:
LAT: 20.04S, LON: 174.23W, DEPTH:  80
Mw: 7.8, mb: 0.0, Ms: 0.0
Mo=  0.519E+28 (dyne-cm)

No. of Stations:  55, GAP:  52
Error (clvd/dc)*100=  44.38
Bandpass:  40 - 100 sec
Nodal plane parameters
      strike     dip    rake
NP1:      18      77      70
NP2:     257      23     146

             --------------#
          -----------------####
       ---------###########-######
     ------################-----####
    -----#################---------##
   ----###################-----------#
  ---#####################------------#
 ---#####################--------------#
 --######################---------------
 -########   ###########----------------
 -######## T ###########----------------
 #########   ##########-----------------
 ######################-----------------
 #####################---------   ------
  ###################---------- P -----
   #################-----------   ----
    ###############------------------
     #############------------------
       ##########-----------------
          ######---------------
             ##-------------


Stat Dist Az Misfit   Stat Dist Az Misfit
116A  79  49  0.96    A05A  82  31  2.59
ARMA  32 244  6.25    ATKA  71   0  0.30
BBOO  45 243  0.53    BC3   77  46  1.14
BILL  88 352  0.30    BJT   88 313  0.44
BLDU  62 245  0.52    BW06  86  41  1.38
C05A  82  32  2.42    CASY  65 205  0.39
CHTO  93 288  0.32    CTAO  37 262  0.25
D04A  81  32  2.89    D05A  81  33  2.46
EIDS  32 254  0.62    FITZ  56 261  0.41
FORT  52 246 25.24    HATC  77  38  2.45
HIA   90 323  0.36    I03A  78  34  3.13
KIP   44  21  1.20    KMBL  57 244  0.48
KSM   76 276  0.35    KUM   87 276  0.39
L09A  80  39  2.24    MAUI  44  24  2.06
MBWA  61 256  0.30    MCK   85  10  0.37
MIDW  48 356  0.39    NEW   84  34  2.34
NIKO  72   3  0.27    NNA   92 103  0.45
NWAO  61 242  0.29    PMG   38 280  0.25
POHA  43  25  2.11    PPLA  84   9  0.30
PTCN  40 105  0.82    QIZ   83 292  0.39
SBA   58 184  0.42    SNCC  74  45  1.34
STKA  41 244  0.28    TNA   85   2  0.28
TOO   39 234 12.65    TOV   75  44  1.30
TRQA  94 132  0.42    TUC   79  50  1.18
U05C  75  42  1.51    UNV   73   4  0.27
VNDA  58 185  0.41    W15A  80  47  0.98
WMOK  89  52  0.71    WRAB  48 260  0.31
YNG   35 238  0.30
 Misfit > 1 heavily downweighted
|
 Epicenter: -20.035 -174.227
 MW 8.1

 USGS MOMENT TENSOR SOLUTION
 Depth   5         No. of sta: 44
 Moment Tensor;   Scale 10**21 Nm
   Mrr= 0.16       Mtt=-0.46
   Mff= 0.30       Mrt= 0.50
   Mrf= 1.67       Mtf=-0.05
  Principal axes:
   T  Val=  1.94  Plg=44  Azm=281
   N       -0.36       9       19
   P       -1.58      44      118

 Best Double Couple:Mo=1.8*10**21
  NP1:Strike=290 Dip= 9 Slip=-180
  NP2:       199     90       -81

               -------
          ---#########--###
        -##############----##
      -###############-------##
    -#################---------##
   ##################-----------##
   #################-------------#
  #######   ########--------------#
  ####### T #######----------------
  #######   ######-----------------
  ################-------   -------
  ###############-------- P -------
   ##############--------   ------
   #############------------------
    ###########------------------
      #########----------------
        ######---------------
          ###--------------
               -------
|
May 3, 2006, TONGA, MW=7.9

Natasha Maternovskaya
Goran Ekstrom

CENTROID, MOMENT TENSOR SOLUTION
HARVARD EVENT-FILE NAME M050306A
DATA USED: GSN
MANTLE WAVES:    48S, 85C, T=150
CENTROID LOCATION:
ORIGIN TIME       15:27: 8.7 0.5
LAT 20.33S 0.04;LON 174.03W 0.05
DEP  65.5 1.7;HALF-DURATION 24.6
MOMENT TENSOR; SCALE 10**28 D-CM
  MRR= 0.59 0.01; MTT=-0.17 0.01
  MPP=-0.42 0.01; MRT= 0.11 0.02
  MRP= 0.75 0.02; MTP=-0.28 0.01
 PRINCIPAL AXES:
 1.(T) VAL=  0.99;PLG=62;AZM=266
 2.(N)      -0.05;    12;     18
 3.(P)      -0.94;    26;    114
BEST DOUBLE COUPLE:M0=1.0*10**28
 NP1:STRIKE=228;DIP=22;SLIP= 122
 NP2:STRIKE= 14;DIP=72;SLIP=  78


            ----------#
        ---------#####--###
      ------##########------#
    -----#############---------
   ----###############----------
  ----################-----------
  ---#################-----------
 ---##################------------
 --#######   #########------------
 --####### T ########-------------
 --#######   ########------   ----
  -#################------- P ---
  -################--------   ---
   -###############-------------
    -#############-------------
      ###########------------
        ########-----------
            ##---------
|
The following broadband stations were used for the source inversion: 116A A05A ARMA ATKA BBOO BC3 BILL BJT BLDU BW06 C05A CASY CHTO CTAO D04A D05A EIDS FITZ FORT HATC HIA I03A KIP KMBL KSM KUM L09A MAUI MBWA MCK MIDW NEW NIKO NNA NWAO PMG POHA PPLA PTCN QIZ SBA SNCC STKA TNA TOO TOV TRQA TUC U05C UNV VNDA W15A WMOK WRAB YNG
|
Location of the earthquake (yellow star) and great circle path from the epicenter to each station (red) [created using GMT (Wessel, P., and W. H. F. Smith, New version of Generic Mapping Tools released, EOS Trans. AGU, 76 329, 1995.)] |
All observed and Greens function waveforms are corrected to instrument response to ground velocity in meters/sec for the passband of 0.01 - 5 Hz. Next tre traces were bandpass filtered by the application of the following high- and low-pass stages:
hp c 0.0083 2
lp c 0.0250 2
The traces were next integrated to ground displacment in meters. Finally waveforms were cut from 30 seconds before to 140 seconds after the P arrival so that the direct P wave, pP and perhaps the sP are included.
The source inversion is a multipass operation since a lower frequency filter band is used for larger earthquakes and since a search is made over depth. Up to three passed of the outer loop are made, after which the moment magnitude is determined and filter settings readjusted. The inner loop over depth samples all depths from 0 to 800 km with 5 km increments in depth to 50 km, followed by 10 km depth sampling for the remaining range.
The following filter ranges are used according to the moment magnitude Mw:
   FILTER_BAND   FH(s)  FL(s)
       1           60     12      Mw < 6.4
       2          100     20      6.4 < Mw <= 6.9
       3          120     40      Mw > 6.9
For this data set the favored solution is
WVFMTD96 80.0 18. 77. 70. 7.78 0.534 0.587E-04 0.592 0.731 0.493E-04 44.4
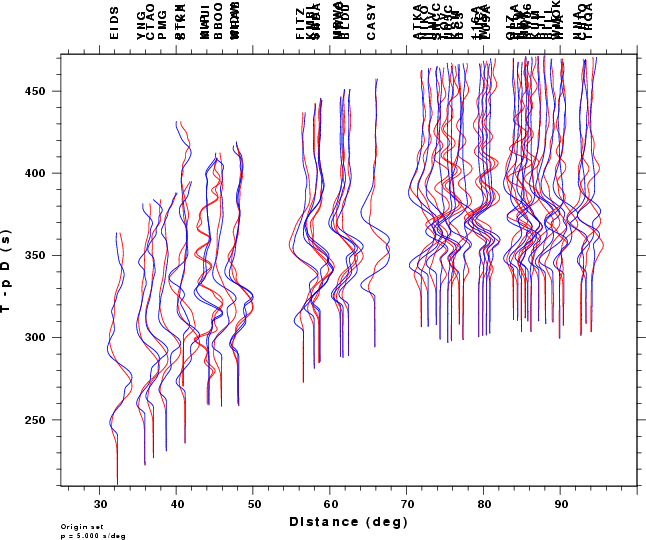
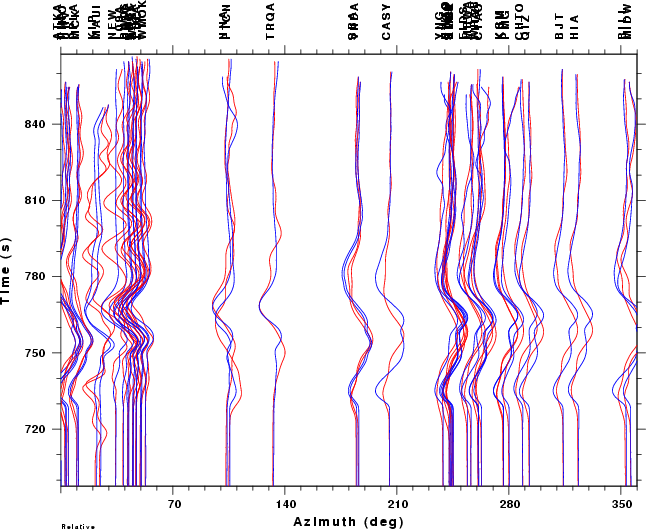
The following figures show the sensitivity of the goodness of fit parameter so source depth, the waveform comparison as a function of epicentral distance in degrees and the source to station azimuth
|
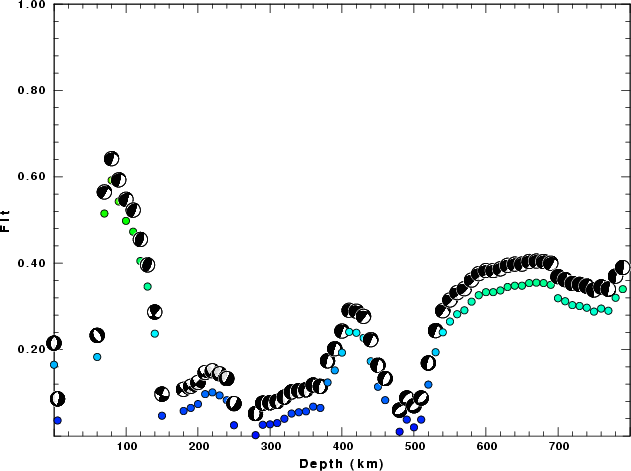
| Goodness of fit as a function of source depth. The measure is 1 - SUM (o -p)2 / SUM o2. A value of 1.0 is the best fit. The best double couple mechanism for the solution depth is plotted above goodness of fit value to indicate how the mefhanism may change with depth. |
|
|
| Comparison of the observed traces (red) and solution predicted traces (blue) as a function of source to station azimuth in degrees (D). The purpose of this display is to highlight the azimuthal dependence on the first motion. The traces are annotated with the station name at the top. |