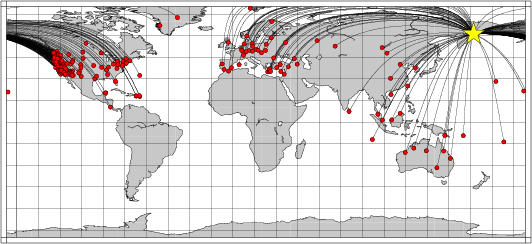
Location of the earthquake (yellow star) and great circle path from the epicenter to each station (red) [created using GMT (Wessel, P., and W. H. F. Smith, New version of Generic Mapping Tools released, EOS Trans. AGU, 76 329, 1995.)]
2006/04/20 23:25:05 61.09 167.10 43
The following compares this source inversion to the USGS Rapid Moment Tensor Solution and to the Harvard CMT solutions, if they are available.
Mw=7.3

2006/04/20 23:25:05    EVID:
LAT: 61.09N, LON: 167.10E, DEPTH:  80
Mw: 7.3, mb: 0.0, Ms: 0.0
Mo=  0.107E+28 (dyne-cm)

No. of Stations: 205, GAP:  45
Error (clvd/dc)*100=  58.82
Bandpass:  40 - 100 sec
Nodal plane parameters
      strike     dip    rake
NP1:      41      46      91
NP2:     219      44      89

             ---------------
          ---------------------
       ----------------###########
     --------------###############--
    ------------###################--
   -----------#####################---
  ----------#######################----
 ----------#######################------
 ---------########################------
 --------##########   ###########-------
 -------########### T ###########-------
 ------############   ##########--------
 ------########################---------
 ------######################-----------
  ----######################-----------
   ---####################------------
    ---#################----------
     --##############------------- P
       -########------------------
          ---------------------
             ---------------


Stat Dist Az Misfit   Stat Dist Az Misfit
115A  57  80  0.46    116A  57  79  0.48
A05A  40  74  0.41    ACSO  64  53  1.78
AFI   76 158  0.60    AHID  50  71  0.71
ALLY  64  50  1.36    ANMO  58  74  0.53
ANTO  72 324  0.72    APE   77 329  0.94
ARU   50 316  0.47    B04A  40  76  0.37
BBSR  77  42  2.71    BFO   69 345  1.30
BINY  65  46  2.51    BJT   37 259  0.37
BLA   67  52  1.69    BMN   48  78  0.70
BRNJ  66  46  1.52    BTDF  76 246  2.71
C03A  39  77  0.42    C04A  40  76  0.49
C05A  41  75  0.50    CART  81 350  0.89
CCM   62  60  0.26    CDVI  91  48  0.99
CMB   49  83  0.60    COCO  91 247  2.65
COR   42  79  0.33    CPNY  67  46  2.62
CRPR  90  50  0.98    CRY   54  83  0.35
CSS   77 322  0.62    CTAO  82 199  1.77
CVS   48  84  0.56    D03A  40  77  0.49
D04A  41  76  0.48    D05A  41  76  0.49
DGMT  48  62  1.40    DPC   66 339  1.18
DUG   51  75  0.57    DWPF  75  58  1.38
E04A  41  77  0.44    E05A  42  76  0.43
EIDS  87 194  9.97    ELK   49  76  0.56
ENH   48 257  0.85    ERPA  63  49  2.17
ESK   63 353  1.58    EUO   43  80  0.29
EYMN  54  54  1.29    F03A  41  78  0.39
F04A  42  77  0.41    F05A  42  76  0.38
FARB  48  85  0.50    FFC   44  55  0.92
FITZ  85 219  1.80    GNI   68 316  0.58
GRFO  67 343  1.41    GVD   79 329  0.76
H02A  42  80  0.34    H05A  43  77  0.38
HATC  46  81  0.67    HAWA  43  75  0.40
HGN   67 347  1.52    HKT   67  68  1.10
HLG   63 346  1.01    HNR   70 187  1.59
HRV   66  43  3.88    HUMO  44  81  0.39
HWUT  50  73  0.59    I02A  43  80  0.31
I05A  44  78  0.39    I06A  44  77  0.46
INCN  34 245  0.44    ISCO  54  70  0.51
ISP   75 325  0.67    JTS   89  69  0.73
K01A  43  82  0.33    KBS   39 352  1.16
KCC   50  82  0.77    KEV   46 342  0.55
KHC   68 341  0.62    KIP   46 132  0.62
KIV   66 319  0.71    KKM   66 237  2.22
KONO  58 346  0.94    KSDI  78 320  0.50
KSM   73 240  2.23    KSU1  59  63  1.33
KUM   74 251  1.60    KWP   65 335  0.79
LAST  79 328  0.73    LRAL  68  60  1.04
M02C  45  82  0.47    M03C  45  81  0.54
M04C  45  81  0.57    M06C  46  80  0.61
M07A  47  79  0.63    MAHO  78 346  1.54
MALT  72 319  0.61    MAUI  47 130  0.44
MBWA  90 223  3.26    MCWV  65  51  1.78
MEGW  41  78  0.58    MELI  83 351  2.06
MIDW  34 155  0.65    MNTX  61  75  0.67
MONP  55  83  0.35    MORC  66 339  1.00
MPR   89  50  0.88    MSO   45  70  1.66
MTE   78 355  1.93    N02C  45  83  1.49
NATX  66  66  1.13    NCB   64  44  2.78
O03C  47  82  0.59    O04C  47  81  0.60
O06A  47  80  0.60    O08A  48  79  0.68
OBN   57 328  0.41    OCWA  40  77  0.40
OFR   39  77  0.58    ORV   47  82  0.61
P08A  49  79  0.67    PALK  81 270  1.22
PFO   54  83  0.36    PIN   44  78  0.97
PKD   50  84  0.43    PMG   72 200  2.29
PSZ   68 336  0.91    Q04C  48  83  0.58
Q09A  50  79  0.56    QIZ   57 249  0.92
R04C  48  83  0.53    R06C  49  81  0.55
R07C  49  81  0.50    RGN   62 343  0.87
RRX   53  82  0.35    RSSD  52  65  0.71
RUE   64 342  0.99    S06C  49  82  0.50
S09A  51  80  0.48    SANT  77 329  0.61
SAO   49  85  1.22    SBC   52  85  0.33
SDCO  56  71  0.39    SDMD  67  49  4.56
SDP   52  85  0.40    SENI  71 345  0.99
SFJD  49  18  4.04    SFS   82 354  1.56
SHO   53  81  0.38    SLA   52  82  0.34
SMER  54  83  0.36    SMM   51  84  0.38
SNCC  53  86  0.34    STKA  94 201  2.11
STU   69 344  1.24    STVI  90  48  0.98
SUMG  45  10  2.14    SUTB  47  83  0.63
SUW   61 336  0.60    SVD   54  83  0.32
TAKO  43  81  0.45    TATO  47 241  1.71
TEIG  79  67  1.03    TIRR  69 329  0.75
TLY   35 283  0.41    TOLO  42  80  0.35
TOV   53  84  0.36    TPNV  52  80  0.45
TUC   58  79  0.75    U05C  50  84  0.44
ULN   35 276  0.35    V03C  50  85  0.41
V04C  51  85  0.43    V05C  51  84  0.46
VCS   53  83  0.37    VES   51  83  0.39
VOS   48 306  0.51    VSU   56 336  0.56
VTV   53  83  0.33    W12A  54  80  0.38
W14A  55  79  0.38    W15A  55  78  0.42
WCI   64  56  3.35    WDC   46  82  0.46
WIFE  44  79  0.39    WLF   68 346  1.20
WRAB  84 210  1.79    WUAZ  55  77  0.42
WVOR  46  78  0.71    WVT   65  59  1.71
X13A  55  80  0.39    X14A  55  79  0.41
X15A  56  79  0.40    Y12C  55  81  0.40
Y13A  55  80  0.40    Y14A  56  80  0.41
Y22C  58  75  0.58    YAQ   55  83  0.34
YBH   45  81  0.45    Z14A  56  80  0.45
ZKR   78 328  0.67
 Misfit > 1 heavily downweighted
|
Mw=7.4 KORYAKIA, RUSSIA

2006/04/20 23:25: 5.40    EVID: LTBT
LAT: 61.09N, LON: 167.10E, DEPTH:  60
Mw: 7.4, mb: 7.7, Ms: 7.7
Mo=  0.146E+28 (dyne-cm)

No. of Stations:  22, GAP:  87
Error (clvd/dc)*100=  44.20

Nodal plane parameters
      strike     dip    rake
NP1:      66      53     111
NP2:     214      42      65

                ----------
           --------------------
        --------------############
      -------------#################
     -----------#####################
    ----------########################
   ----------##########################
  ---------############################-
  --------############################--
 --------############################----
 --------###########################-----
 -------###########################------
 -------#########################--------
  -----########################---------
  -----#####################------------
   ----##################--------------
    ###############-------------------
     ###-----------------------------
      ##----------------------------
        #-------------------------
           --------------------
                ----------

Stat Dist Az Misfit   Stat Dist Az Misfit
AAK   54 295  0.17    AFI   76 158  0.33
ANMO  58  74  0.52    ARU   50 316  0.56
BORG  54   4  1.39    BW06  50  70  0.74
CMB   49  83  0.52    COR   42  79  0.32
FCC   44  46  0.66    FFC   44  55  0.74
HKT   67  68  1.56    INCN  34 245  0.50
KEV   46 342  1.18    KONO  58 346  0.60
MOD   46  79  0.34    MSO   45  70  1.13
OBN   57 328  0.63    SIT   29  71  0.75
TLY   35 283  0.34    TUC   58  79  0.67
ULN   35 276  0.32    WDC   46  82  0.32

Median of misfit:  0.58
  Average misfit:  0.65
|
April 20, 2006, KORYAKIA, RUSSIA, MW=7.6

Goran Ekstrom

CENTROID, MOMENT TENSOR SOLUTION
HARVARD EVENT-FILE NAME C042006A
DATA USED: GSN
L.P. BODY WAVES: 72S,189C, T= 50
MANTLE WAVES:    73S,185C, T=150
CENTROID LOCATION:
ORIGIN TIME       23:25:18.4 0.1
LAT 60.91N 0.01;LON 166.98E 0.02
DEP  12.0 FIX;HALF-DURATION 15.3
MOMENT TENSOR; SCALE 10**27 D-CM
  MRR= 2.82 0.01; MTT=-0.86 0.01
  MPP=-1.96 0.01; MRT= 0.67 0.14
  MRP= 0.25 0.13; MTP=-1.63 0.01
 PRINCIPAL AXES:
 1.(T) VAL=  2.94;PLG=80;AZM=  2
 2.(N)       0.25;     8;    217
 3.(P)      -3.19;     6;    126
BEST DOUBLE COUPLE:M0=3.1*10**27
 NP1:STRIKE=207;DIP=40;SLIP=  77
 NP2:STRIKE= 44;DIP=51;SLIP= 101

            -----------
        -----------########
      ---------##############
    ---------################--
   --------##################---
  --------###################----
  -------#######   ##########----
 -------######## T #########------
 ------#########   ########-------
 ------###################--------
 ------##################---------
  ----##################---------
  -----###############-----------
   ----#############---------
    ---##########------------ P
      --####-----------------
        #------------------
            -----------
|
The following broadband stations were used for the source inversion: 115A 116A A05A ACSO AFI AHID ALLY ANMO ANTO APE ARU B04A BBSR BFO BINY BJT BLA BMN BRNJ BTDF C03A C04A C05A CART CCM CDVI CMB COCO COR CPNY CRPR CRY CSS CTAO CVS D03A D04A D05A DGMT DPC DUG DWPF E04A E05A EIDS ELK ENH ERPA ESK EUO EYMN F03A F04A F05A FARB FFC FITZ GNI GRFO GVD H02A H05A HATC HAWA HGN HKT HLG HNR HRV HUMO HWUT I02A I05A I06A INCN ISCO ISP JTS K01A KBS KCC KEV KHC KIP KIV KKM KONO KSDI KSM KSU1 KUM KWP LAST LRAL M02C M03C M04C M06C M07A MAHO MALT MAUI MBWA MCWV MEGW MELI MIDW MNTX MONP MORC MPR MSO MTE N02C NATX NCB O03C O04C O06A O08A OBN OCWA OFR ORV P08A PALK PFO PIN PKD PMG PSZ Q04C Q09A QIZ R04C R06C R07C RGN RRX RSSD RUE S06C S09A SANT SAO SBC SDCO SDMD SDP SENIN SFJD SFS SHO SLA SMER SMM SNCC STKA STU STVI SUMG SUTB SUW SVD TAKO TATO TEIG TIRR TLY TOLO TOV TPNV TUC U05C ULN V03C V04C V05C VCS VES VOS VSU VTV W12A W14A W15A WCI WDC WIFE WLF WRAB WUAZ WVOR WVT X13A X14A X15A Y12C Y13A Y14A Y22C YAQ YBH Z14A ZKR
|
Location of the earthquake (yellow star) and great circle path from the epicenter to each station (red) [created using GMT (Wessel, P., and W. H. F. Smith, New version of Generic Mapping Tools released, EOS Trans. AGU, 76 329, 1995.)] |
All observed and Greens function waveforms are corrected to instrument response to ground velocity in meters/sec for the passband of 0.01 - 5 Hz. Next tre traces were bandpass filtered by the application of the following high- and low-pass stages:
hp c 0.0083 2
lp c 0.0250 2
The traces were next integrated to ground displacment in meters. Finally waveforms were cut from 30 seconds before to 140 seconds after the P arrival so that the direct P wave, pP and perhaps the sP are included.
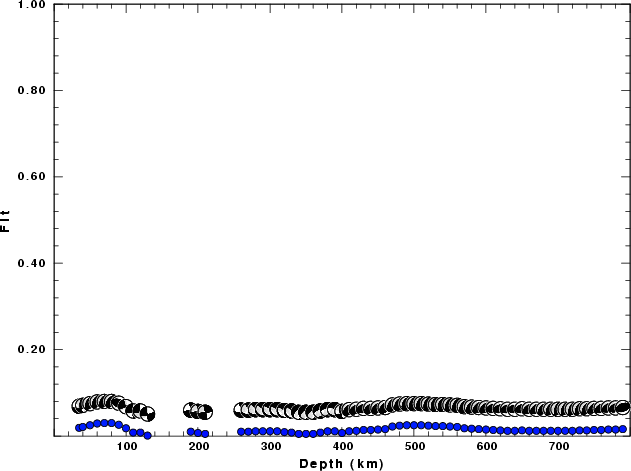
The source inversion is a multipass operation since a lower frequency filter band is used for larger earthquakes and since a search is made over depth. Up to three passed of the outer loop are made, after which the moment magnitude is determined and filter settings readjusted. The inner loop over depth samples all depths from 0 to 800 km with 5 km increments in depth to 50 km, followed by 10 km depth sampling for the remaining range.
The following filter ranges are used according to the moment magnitude Mw:
   FILTER_BAND   FH(s)  FL(s)
       1           60     12      Mw < 6.4
       2          100     20      6.4 < Mw <= 6.9
       3          120     40      Mw > 6.9
For this data set the favored solution is
WVFMTD96 80.0 41. 46. 91. 7.32 0.021 0.780E-04 0.030 0.146 0.548E-04 58.8
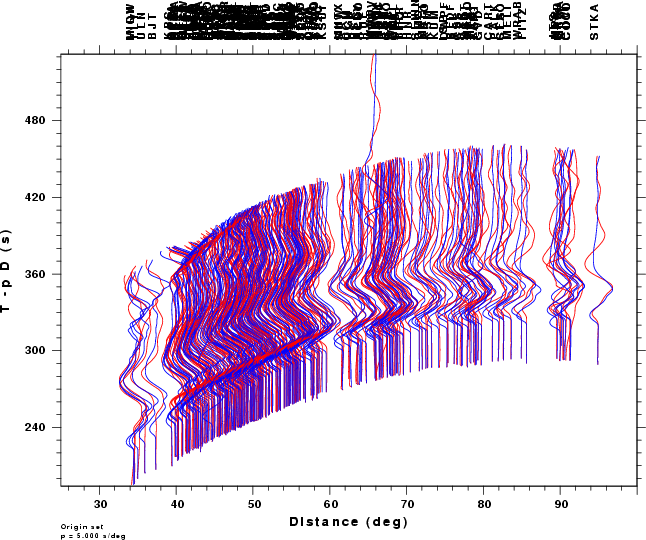
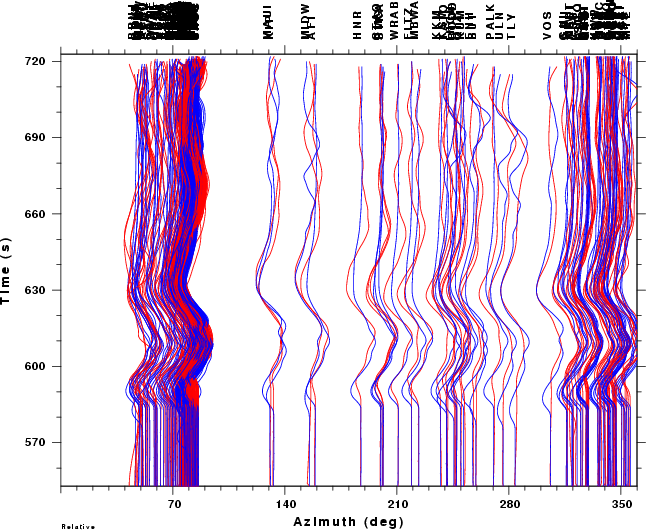
The following figures show the sensitivity of the goodness of fit parameter so source depth, the waveform comparison as a function of epicentral distance in degrees and the source to station azimuth
|
| Goodness of fit as a function of source depth. The measure is 1 - SUM (o -p)2 / SUM o2. A value of 1.0 is the best fit. The best double couple mechanism for the solution depth is plotted above goodness of fit value to indicate how the mefhanism may change with depth. |
|
|
| Comparison of the observed traces (red) and solution predicted traces (blue) as a function of source to station azimuth in degrees (D). The purpose of this display is to highlight the azimuthal dependence on the first motion. The traces are annotated with the station name at the top. |