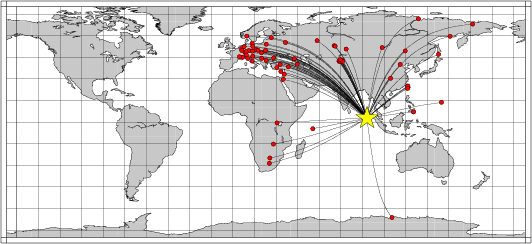
Location of the earthquake (yellow star) and great circle path from the epicenter to each station (red) [created using GMT (Wessel, P., and W. H. F. Smith, New version of Generic Mapping Tools released, EOS Trans. AGU, 76 329, 1995.)]
2006/04/19 20:36:46 2.72 93.13 10
The following compares this source inversion to the USGS Rapid Moment Tensor Solution and to the Harvard CMT solutions, if they are available.
Mw=6.2

2006/04/19 20:36:46    EVID:
LAT:  2.72N, LON:  93.13E, DEPTH:  10
Mw: 6.2, mb: 0.0, Ms: 0.0
Mo=  0.196E+26 (dyne-cm)

No. of Stations:  67, GAP:  91
Error (clvd/dc)*100=   9.82
Bandpass:  12 -  60 sec
Nodal plane parameters
      strike     dip    rake
NP1:     178      82     -18
NP2:     270      72    -171

             ------#########
          ---------############
       ------------###############
     --------------#################
    ---------------##################
   ---------------####################
  ----------------#####################
 -----------------######################
 ----------#######-----------###########
 ---##############------------------####
 ##################---------------------
 ##################---------------------
 ##################---------------------
 ##################---------------------
  #################--------------------
   ################------------   ----
    ##   ##########------------ P ---
     # T ###########-----------   --
         ###########--------------
          ##########-----------
             ########-------


Stat Dist Az Misfit   Stat Dist Az Misfit
AAK   43 339  0.49    AML   42 338  0.51
ANTO  65 312  4.13    AQU   80 312  3.17
ARU   60 338  1.52    BFO   84 318  2.01
BILL  81  21  1.23    BJT   42  26  0.61
BNI   85 314  2.05    BOSA  72 238  0.64
BRVK  53 343  0.92    CASY  69 172  0.56
CHM   43 340  0.52    CSS   63 307  4.93
DAV   32  81  0.84    DIVS  76 314  3.98
DPC   79 320  1.90    EIL   61 302  0.92
EKS2  43 339  0.55    ENH   31  27  2.21
GNI   57 317  3.52    GRFO  82 319  1.95
GUMO  52  74  1.00    HGN   86 320  2.32
HIA   51  21  1.39    IBBN  85 322  1.92
ISP   66 310  3.57    KHC   81 319  0.87
KIV   60 320  3.16    KONO  84 329  1.71
KSDI  61 306  1.96    KURK  49 347  1.03
KWP   75 320  1.57    KZA   42 340  0.41
LBTB  70 242  0.59    LSZ   66 252  0.67
MA2   71  26  1.18    MALT  61 312  3.02
MBAR  62 267  1.52    MORC  78 320  1.81
MSEY  38 259  2.08    NACB  34  49  0.57
OBN   69 329  1.79    PSZ   76 318  2.48
RGN   81 324  1.67    RUE   81 322  1.84
SSB   87 315  2.27    STU   83 318  2.21
SUW   76 325  1.76    TATO  35  48  0.74
TIRR  70 316  3.24    TIXI  72  11  1.17
TKM2  42 341  0.44    TLY   49   8  1.32
TRI   80 315  2.18    TUE   83 316  2.32
UCH   42 339  0.45    ULHL  42 341  0.45
USP   43 340  0.44    VLC   82 313  2.81
VOS   53 343  1.22    VSU   75 330  1.67
VTS   73 313  4.36    WLF   85 319  1.83
YHNB  34  48  0.73    YSS   61  36  0.50
YULB  34  50  0.82
 Misfit > 1 heavily downweighted
|
 OFF W COAST OF NORTHERN SUMATRA
 Epicenter:   2.722   93.133
 MW 6.0

 USGS MOMENT TENSOR SOLUTION
 Depth  25         No. of sta: 21
 Moment Tensor;   Scale 10**18 Nm
   Mrr= 0.18       Mtt=-0.95
   Mff= 0.77       Mrt=-0.02
   Mrf=-0.58       Mtf=-1.01
  Principal axes:
   T  Val=  1.45  Plg=22  Azm= 67
   N        0.01      65      222
   P       -1.46       9      333

 Best Double Couple:Mo=1.5*10**18
  NP1:Strike=108 Dip=67 Slip= 170
  NP2:       202     81        23

               -------
             -----------###
        -- P ----------######
      ----   ---------#########
    -----------------############
   -----------------#########   ##
   ----------------########## T ##
  ##--------------###########   ###
  ####-----------##################
  #######--------##################
  ##########----###################
  #############-###################
   ############--------###########
   ###########--------------------
    ##########-------------------
      #######------------------
        #####----------------
          ##---------------
               -------
|
April 19, 2006, OFF W COAST OF NORTHERN SUMATRA, MW=6.2

Natasha Maternovskaya

CENTROID, MOMENT TENSOR SOLUTION
HARVARD EVENT-FILE NAME C041906A
DATA USED: GSN
L.P. BODY WAVES: 76S,181C, T= 40
MANTLE WAVES:    74S,136C, T=125
CENTROID LOCATION:
ORIGIN TIME       20:36:50.4 0.1
LAT  2.85N 0.01;LON  93.19E 0.01
DEP  15.5 1.2;HALF-DURATION  3.1
MOMENT TENSOR; SCALE 10**25 D-CM
  MRR=-0.34 0.02; MTT=-1.28 0.02
  MPP= 1.61 0.02; MRT=-0.08 0.04
  MRP=-0.15 0.05; MTP=-1.72 0.02
 PRINCIPAL AXES:
 1.(T) VAL=  2.42;PLG= 2;AZM= 65
 2.(N)      -0.33;    85;    180
 3.(P)      -2.09;     5;    335
BEST DOUBLE COUPLE:M0=2.3*10**25
 NP1:STRIKE=110;DIP=85;SLIP=-178
 NP2:STRIKE= 20;DIP=88;SLIP=  -5

            -----------
        - P -----------####
      ---   ----------#######
    -----------------##########
   ------------------##########
  ------------------########### T
  ##----------------###########
 #######-----------###############
 ###########------################
 ################-################
 ################-----############
  ##############------------#####
  #############------------------
   ############-----------------
    ##########-----------------
      #######----------------
        #####--------------
            -----------
|
The following broadband stations were used for the source inversion: AAK AML ANTO AQU ARU BFO BILL BJT BNI BOSA BRVK CASY CHM CSS DAV DIVS DPC EIL EKS2 ENH GNI GRFO GUMO HGN HIA IBBN ISP KHC KIV KONO KSDI KURK KWP KZA LBTB LSZ MA2 MALT MBAR MORC MSEY NACB OBN PSZ RGN RUE SSB STU SUW TATO TIRR TIXI TKM2 TLY TRI TUE UCH ULHL USP VLC VOS VSU VTS WLF YHNB YSS YULB
|
Location of the earthquake (yellow star) and great circle path from the epicenter to each station (red) [created using GMT (Wessel, P., and W. H. F. Smith, New version of Generic Mapping Tools released, EOS Trans. AGU, 76 329, 1995.)] |
All observed and Greens function waveforms are corrected to instrument response to ground velocity in meters/sec for the passband of 0.01 - 5 Hz. Next tre traces were bandpass filtered by the application of the following high- and low-pass stages:
hp c 0.0167 2
lp c 0.0833 2
The traces were next integrated to ground displacment in meters. Finally waveforms were cut from 30 seconds before to 140 seconds after the P arrival so that the direct P wave, pP and perhaps the sP are included.
The source inversion is a multipass operation since a lower frequency filter band is used for larger earthquakes and since a search is made over depth. Up to three passed of the outer loop are made, after which the moment magnitude is determined and filter settings readjusted. The inner loop over depth samples all depths from 0 to 800 km with 5 km increments in depth to 50 km, followed by 10 km depth sampling for the remaining range.
The following filter ranges are used according to the moment magnitude Mw:
   FILTER_BAND   FH(s)  FL(s)
       1           60     12      Mw < 6.4
       2          100     20      6.4 < Mw <= 6.9
       3          120     40      Mw > 6.9
For this data set the favored solution is
WVFMTD96 10.0 178. 82. -18. 6.16 0.208 0.452E-06 0.285 0.468 0.356E-06 9.8
The following figures show the sensitivity of the goodness of fit parameter so source depth, the waveform comparison as a function of epicentral distance in degrees and the source to station azimuth
|
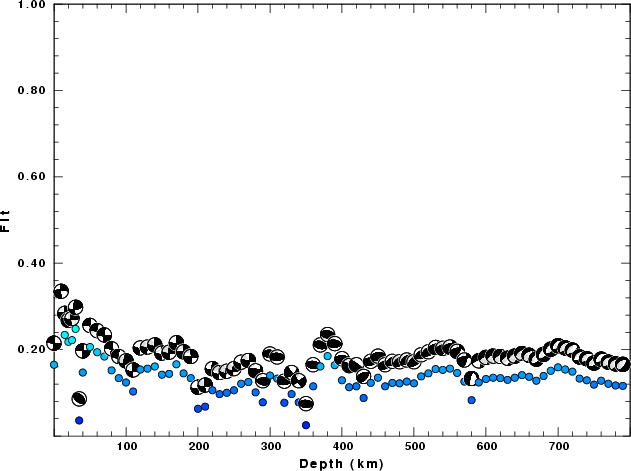
| Goodness of fit as a function of source depth. The measure is 1 - SUM (o -p)2 / SUM o2. A value of 1.0 is the best fit. The best double couple mechanism for the solution depth is plotted above goodness of fit value to indicate how the mefhanism may change with depth. |
|
|
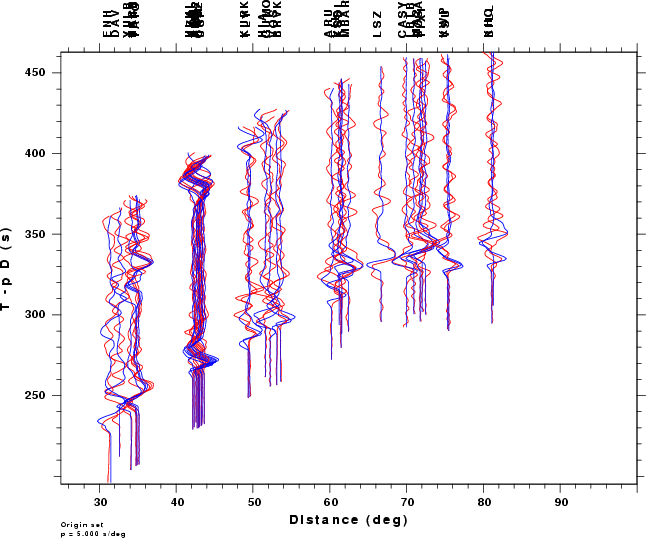
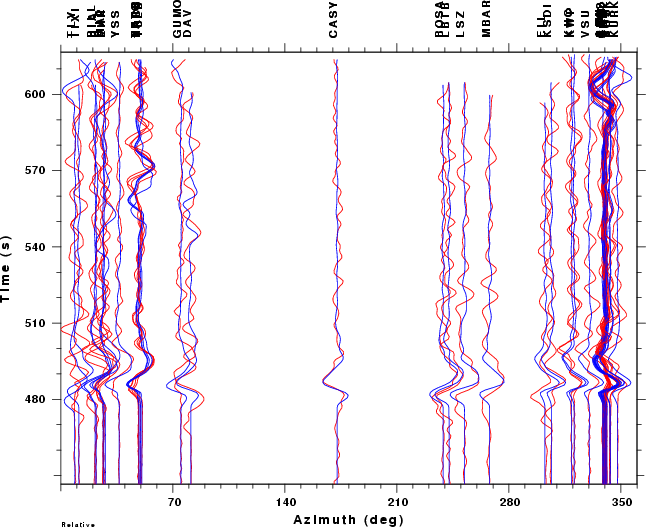
| Comparison of the observed traces (red) and solution predicted traces (blue) as a function of source to station azimuth in degrees (D). The purpose of this display is to highlight the azimuthal dependence on the first motion. The traces are annotated with the station name at the top. |