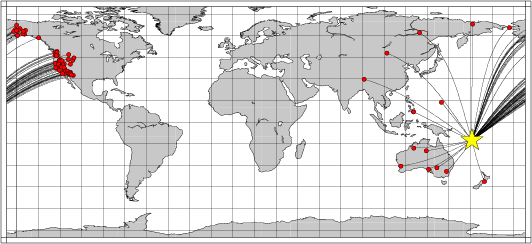
Location of the earthquake (yellow star) and great circle path from the epicenter to each station (red) [created using GMT (Wessel, P., and W. H. F. Smith, New version of Generic Mapping Tools released, EOS Trans. AGU, 76 329, 1995.)]
2006/04/17 23:50:06 -12.63 165.96 71
The following compares this source inversion to the USGS Rapid Moment Tensor Solution and to the Harvard CMT solutions, if they are available.
Mw=6.0

2006/04/17 23:50:06    EVID:
LAT: 12.63S, LON: 165.96E, DEPTH:  25
Mw: 6.0, mb: 0.0, Ms: 0.0
Mo=  0.111E+26 (dyne-cm)

No. of Stations:  68, GAP: 109
Error (clvd/dc)*100=  32.48
Bandpass:  12 -  60 sec
Nodal plane parameters
      strike     dip    rake
NP1:     141      49      97
NP2:     310      42      82

             ---------------
          ---------------------
       #--------------------------
     #-##############---------------
    ---##################------------
   ----####################-----------
  -----######################----------
 ------########################---------
 -------########################--------
 -------#############   ##########------
 --------############ T ###########-----
 ---------###########   ###########-----
 ----------#########################----
 -----------########################----
  ------------######################---
   -------------####################--
    -   ----------##################-
      P -------------###############
        -----------------#########
          ---------------------
             ---------------


Stat Dist Az Misfit   Stat Dist Az Misfit
115A  89  56  0.25    A05A  87  38  0.22
AHID  93  47  0.55    B04A  86  39  0.21
B05A  87  39  0.26    BBOO  33 228  0.48
BESE  85  26  0.25    BILL  80   0  0.31
BLDU  48 240  0.56    BMN   88  48  0.65
BMR   83  21  0.27    BNLO  83  49  0.28
BPAW  83  17  0.35    COLA  84  18  0.33
COLD  85  15  0.35    DAV   44 293  0.81
DIV   82  21  0.29    DOT   85  20  0.70
DUG   91  49  0.27    E03A  86  40  0.28
E05A  87  41  0.20    F04A  86  41  0.23
FARB  83  49  0.59    FITZ  39 256  0.59
FUR   87  51  0.29    GSC   87  53  0.27
GUMO  33 320  0.61    HATC  85  46  0.35
HLID  91  45  0.29    IRM   88  54  0.18
J06A  87  44  0.17    K06A  86  45  0.19
LAVA  85  48  0.25    LKWY  94  45  0.95
LSA   83 302  0.37    MCK   83  18  0.34
MOD   86  45  0.27    MSO   92  42  0.44
N02C  84  46  0.76    O04C  85  47  0.26
O05C  85  47  0.21    P08A  87  48  0.27
PAX   84  20  0.71    PFO   86  54  0.25
PKD   84  51  0.38    PPLA  81  17  0.26
R06C  86  49  0.26    R07C  86  49  0.29
RPV   85  54  0.43    S09A  87  50  0.24
SNZO  29 166  0.38    STKA  29 225  0.42
SWD   80  20  0.30    TNA   80  10  0.29
TRF   82  18  0.30    TUC   91  57  0.23
TUQ   87  53  0.60    ULN   79 324  0.36
W12A  88  53  0.33    WRAB  31 252  0.49
WVOR  87  45  0.25    X14A  89  54  0.23
Y12C  88  55  0.23    Y13A  88  55  0.30
Y14A  89  55  0.22    YAK   79 343  0.29
YNG   26 213  0.64    Z14A  89  55  0.25
 Misfit > 1 heavily downweighted
|
SANTA CRUZ ISLANDS

2006/04/17 23:50: 6.58    EVID: LQBV
LAT: 12.63S, LON: 165.97E, DEPTH:  20
Mw: 5.9, mb: 6.0, Ms: 6.0
Mo=  0.782E+25 (dyne-cm)

No. of Stations:   7, GAP: 144
Error (clvd/dc)*100=   1.12

Nodal plane parameters
      strike     dip    rake
NP1:     150      52      83
NP2:     342      39      99

                ----------
           ##########----------
        --##############----------
      ----################----------
     ----###################---------
    -----#####################--------
   ------######################--------
  -------#######################--------
  -------#######################--------
 ---------#######################--------
 ---------#######################--------
 ----------#######################-------
 -----------######################-------
  -----------#####################------
  ------------####################------
   ------------##################------
    -------------################-----
     --------------#############-----
      ---------------##########-----
        -----------------#####----
           ------------------##
                ----------

Stat Dist Az Misfit   Stat Dist Az Misfit
CMB   85  49  0.48    INCN  62 325  0.39
MAJO  55 332  0.33    TIXI  87 348  0.37
TLY   83 326  0.45    VNDA  64 180  0.44
YSS   62 342  0.60

Median of misfit:  0.44
  Average misfit:  0.44
|
April 17, 2006, SANTA CRUZ ISLANDS, MW=6.1

Natasha Maternovskaya

CENTROID, MOMENT TENSOR SOLUTION
HARVARD EVENT-FILE NAME C041706A
DATA USED: GSN
L.P. BODY WAVES: 78S,180C, T= 40
MANTLE WAVES:    66S,103C, T=125
CENTROID LOCATION:
ORIGIN TIME       23:50: 4.9 0.1
LAT 12.58S 0.01;LON 166.23E 0.01
DEP  31.7 0.8;HALF-DURATION  2.7
MOMENT TENSOR; SCALE 10**25 D-CM
  MRR= 1.49 0.01; MTT=-0.13 0.02
  MPP=-1.36 0.02; MRT= 0.42 0.04
  MRP=-0.71 0.04; MTP= 0.54 0.02
 PRINCIPAL AXES:
 1.(T) VAL=  1.70;PLG=75;AZM= 50
 2.(N)       0.06;     4;    157
 3.(P)      -1.76;    14;    248
BEST DOUBLE COUPLE:M0=1.7*10**25
 NP1:STRIKE=345;DIP=31;SLIP=  99
 NP2:STRIKE=155;DIP=59;SLIP=  85

            ####-------
        --###########------
      ---##############------
    -----################------
   ------#################------
  -------##################------
  --------########   #######-----
 ---------######## T ########-----
 ---------########   ########-----
 ----------##################-----
 --   ------#################-----
  - P -------################----
  -   --------###############----
   ------------#############----
    -------------##########----
      -------------#######---
        --------------###--
            ----------#
|
The following broadband stations were used for the source inversion: 115A A05A AHID B04A B05A BBOO BESE BILL BLDU BMN BMR BNLO BPAW COLA COLD DAV DIV DOT DUG E03A E05A F04A FARB FITZ FUR GSC GUMO HATC HLID IRM J06A K06A LAVA LKWY LSA MCK MOD MSO N02C O04C O05C P08A PAX PFO PKD PPLA R06C R07C RPV S09A SNZO STKA SWD TNA TRF TUC TUQ ULN W12A WRAB WVOR X14A Y12C Y13A Y14A YAK YNG Z14A
|
Location of the earthquake (yellow star) and great circle path from the epicenter to each station (red) [created using GMT (Wessel, P., and W. H. F. Smith, New version of Generic Mapping Tools released, EOS Trans. AGU, 76 329, 1995.)] |
All observed and Greens function waveforms are corrected to instrument response to ground velocity in meters/sec for the passband of 0.01 - 5 Hz. Next tre traces were bandpass filtered by the application of the following high- and low-pass stages:
hp c 0.0167 2
lp c 0.0833 2
br c 0.12 0.25 n 4 p 2
The traces were next integrated to ground displacment in meters. Finally waveforms were cut from 30 seconds before to 140 seconds after the P arrival so that the direct P wave, pP and perhaps the sP are included.
The source inversion is a multipass operation since a lower frequency filter band is used for larger earthquakes and since a search is made over depth. Up to three passed of the outer loop are made, after which the moment magnitude is determined and filter settings readjusted. The inner loop over depth samples all depths from 0 to 800 km with 5 km increments in depth to 50 km, followed by 10 km depth sampling for the remaining range.
The following filter ranges are used according to the moment magnitude Mw:
   FILTER_BAND   FH(s)  FL(s)
       1           60     12      Mw < 6.4
       2          100     20      6.4 < Mw <= 6.9
       3          120     40      Mw > 6.9
For this data set the favored solution is
WVFMTD96 25.0 141. 49. 97. 6.00 0.526 0.312E-06 0.546 0.735 0.257E-06 32.5
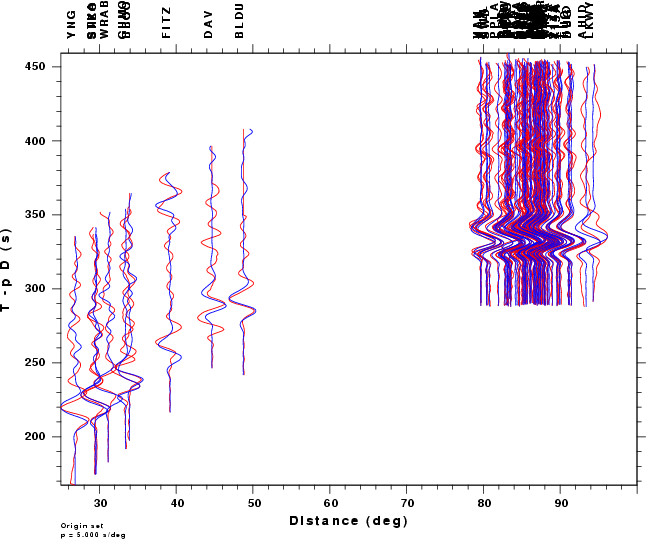
The following figures show the sensitivity of the goodness of fit parameter so source depth, the waveform comparison as a function of epicentral distance in degrees and the source to station azimuth
|
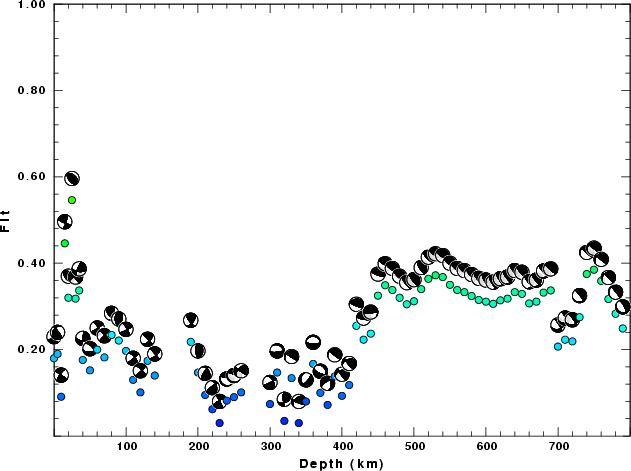
| Goodness of fit as a function of source depth. The measure is 1 - SUM (o -p)2 / SUM o2. A value of 1.0 is the best fit. The best double couple mechanism for the solution depth is plotted above goodness of fit value to indicate how the mefhanism may change with depth. |
|
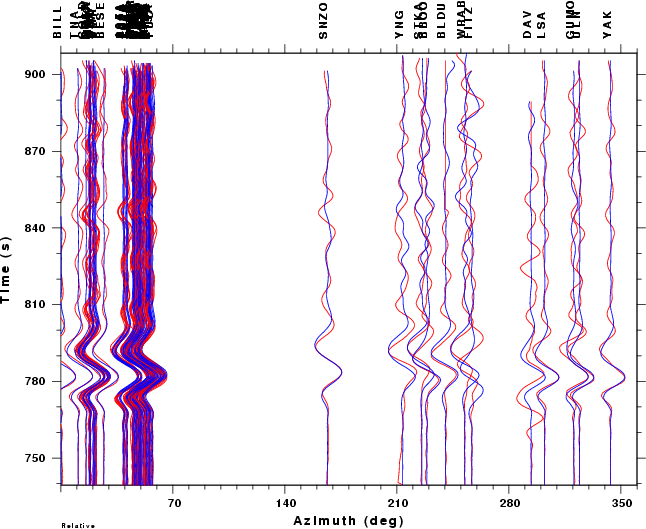
|
| Comparison of the observed traces (red) and solution predicted traces (blue) as a function of source to station azimuth in degrees (D). The purpose of this display is to highlight the azimuthal dependence on the first motion. The traces are annotated with the station name at the top. |