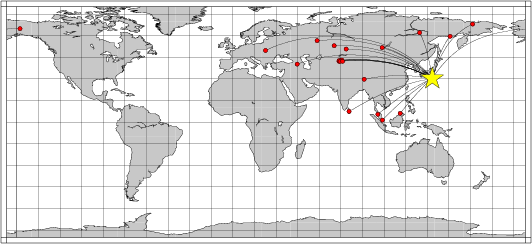
Location of the earthquake (yellow star) and great circle path from the epicenter to each station (red) [created using GMT (Wessel, P., and W. H. F. Smith, New version of Generic Mapping Tools released, EOS Trans. AGU, 76 329, 1995.)]
2006/04/16 11:48:57 30.23 138.51 437
The following compares this source inversion to the USGS Rapid Moment Tensor Solution and to the Harvard CMT solutions, if they are available.
Mw=5.8

2006/04/16 11:48:57    EVID:
LAT: 30.23N, LON: 138.51E, DEPTH: 430
Mw: 5.8, mb: 0.0, Ms: 0.0
Mo=  0.534E+25 (dyne-cm)

No. of Stations:  21, GAP: 196
Error (clvd/dc)*100=  84.15
Bandpass:  12 -  60 sec
Nodal plane parameters
      strike     dip    rake
NP1:       0      80     -69
NP2:     115      24    -154

             --------#######
          ------------#########
       ---------------############
     -----------------##############
    ------------------###############
   --------------------###############
  ---------------------################
 #--------   ----------#########   #####
 #-------- P ----------######### T #####
 #--------   ----------#########   #####
 ##--------------------#################
 ##--------------------#################
 ###-------------------#################
 ####------------------#################
  ####-----------------################
   ####----------------###############
    #####-------------##############-
     #######----------###########---
       #########------########----
          ###########----------
             ########-------


Stat Dist Az Misfit   Stat Dist Az Misfit
AML   52 301  0.31    ARU   59 320  0.23
BILL  41  15  0.90    BRVK  53 315  0.24
BTDF  43 235  0.45    COLA  56  29  0.59
EKS2  52 302  0.31    GNI   73 307  0.35
KBK   51 302  0.36    KKM   31 225  0.34
KUM   43 242  0.48    KURK  48 312  0.31
KWP   82 323  0.70    LSA   40 281  0.50
MA2   30  12  0.67    PALK  58 259  0.49
TKM2  51 302  0.27    TLY   33 319  0.91
UCH   51 301  0.33    ULHL  50 301  0.26
YAK   32 352  1.71
 Misfit > 1 heavily downweighted
|
2006/04/16 11:48:56.39
 IZU ISLANDS, JAPAN REGION
 Epicenter:  30.216  138.544
 MW 5.7

 USGS MOMENT TENSOR SOLUTION
 Depth 424         No. of sta: 12
 Moment Tensor;   Scale 10**17 Nm
   Mrr=-1.07       Mtt= 2.23
   Mff=-1.16       Mrt= 1.56
   Mrf=-3.96       Mtf=-1.96
  Principal axes:
   T  Val=  5.05  Plg=31  Azm= 39
   N        0.04      30      150
   P       -5.09      44      274

 Best Double Couple:Mo=5.1*10**17
  NP1:Strike= 76 Dip=31 Slip=-166
  NP2:       334     83       -60

               #######
          -################
        -----################
      --------##########   ####
    -----------######### T ######
   -------------########   #######
   --------------#################
  ----------------#################
  ------   --------###############-
  ------ P ---------##############-
  ------   ----------############--
  --------------------##########---
   -------------------########----
   ##------------------#####------
    ####----------------#--------
      #######-------#####------
        #################----
          ################-
               #######
|
April 16, 2006, IZU ISLANDS, JAPAN REGION, MW=5.7

Goran Ekstrom

CENTROID, MOMENT TENSOR SOLUTION
HARVARD EVENT-FILE NAME B041606B
DATA USED: GSN
L.P. BODY WAVES: 73S,136C, T= 40
CENTROID LOCATION:
ORIGIN TIME       11:48:58.8 0.2
LAT 30.26N 0.02;LON 138.58E 0.02
DEP 427.1 1.4;HALF-DURATION  1.8
MOMENT TENSOR; SCALE 10**24 D-CM
  MRR=-1.27 0.06; MTT= 2.42 0.08
  MPP=-1.15 0.10; MRT= 1.14 0.10
  MRP=-3.90 0.09; MTP=-2.11 0.08
 PRINCIPAL AXES:
 1.(T) VAL=  4.88;PLG=28;AZM= 38
 2.(N)       0.29;    33;    149
 3.(P)      -5.17;    44;    278
BEST DOUBLE COUPLE:M0=5.0*10**24
 NP1:STRIKE= 78;DIP=35;SLIP=-165
 NP2:STRIKE=335;DIP=81;SLIP= -56

            ###########
        ----###############
      -------##########   ###
    ----------######### T #####
   ------------########   ######
  --------------#################
  ---------------################
 ------   --------################
 ------ P ---------##############-
 ------   ----------############--
 --------------------##########---
  -------------------#########---
  ##------------------######-----
   ###-----------------###------
    ######------------#--------
      ##################-----
        ################---
            ###########
|
The following broadband stations were used for the source inversion: AML ARU BILL BRVK BTDF COLA EKS2 GNI KBK KKM KUM KURK KWP LSA MA2 PALK TKM2 TLY UCH ULHL YAK
|
Location of the earthquake (yellow star) and great circle path from the epicenter to each station (red) [created using GMT (Wessel, P., and W. H. F. Smith, New version of Generic Mapping Tools released, EOS Trans. AGU, 76 329, 1995.)] |
All observed and Greens function waveforms are corrected to instrument response to ground velocity in meters/sec for the passband of 0.01 - 5 Hz. Next tre traces were bandpass filtered by the application of the following high- and low-pass stages:
hp c 0.0167 2
lp c 0.0833 2
The traces were next integrated to ground displacment in meters. Finally waveforms were cut from 30 seconds before to 140 seconds after the P arrival so that the direct P wave, pP and perhaps the sP are included.
The source inversion is a multipass operation since a lower frequency filter band is used for larger earthquakes and since a search is made over depth. Up to three passed of the outer loop are made, after which the moment magnitude is determined and filter settings readjusted. The inner loop over depth samples all depths from 0 to 800 km with 5 km increments in depth to 50 km, followed by 10 km depth sampling for the remaining range.
The following filter ranges are used according to the moment magnitude Mw:
   FILTER_BAND   FH(s)  FL(s)
       1           60     12      Mw < 6.4
       2          100     20      6.4 < Mw <= 6.9
       3          120     40      Mw > 6.9
For this data set the favored solution is
WVFMTD96 430.0 0. 80. -69. 5.78 0.431 0.833E-07 0.561 0.657 0.477E-07 84.2
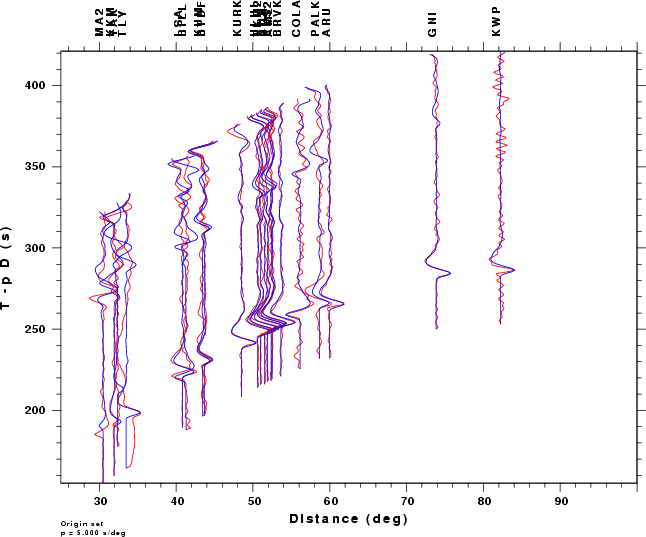
The following figures show the sensitivity of the goodness of fit parameter so source depth, the waveform comparison as a function of epicentral distance in degrees and the source to station azimuth
|
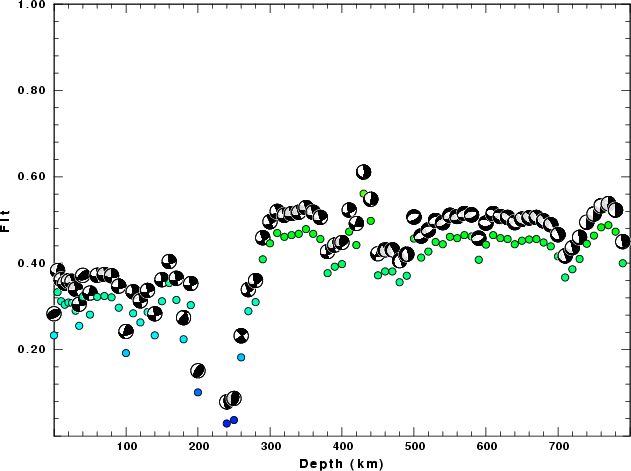
| Goodness of fit as a function of source depth. The measure is 1 - SUM (o -p)2 / SUM o2. A value of 1.0 is the best fit. The best double couple mechanism for the solution depth is plotted above goodness of fit value to indicate how the mefhanism may change with depth. |
|
|
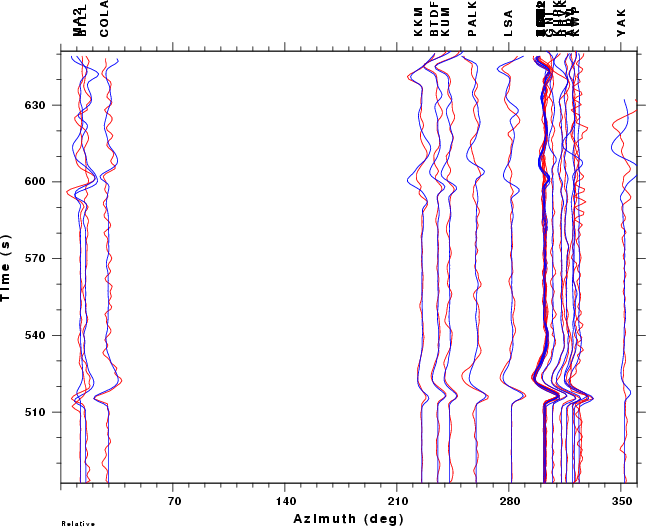
| Comparison of the observed traces (red) and solution predicted traces (blue) as a function of source to station azimuth in degrees (D). The purpose of this display is to highlight the azimuthal dependence on the first motion. The traces are annotated with the station name at the top. |