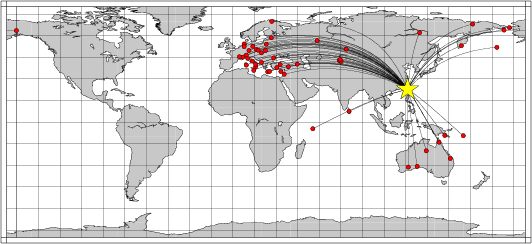
Location of the earthquake (yellow star) and great circle path from the epicenter to each station (red) [created using GMT (Wessel, P., and W. H. F. Smith, New version of Generic Mapping Tools released, EOS Trans. AGU, 76 329, 1995.)]
2006/04/15 22:40:54 22.74 121.30 18
The following compares this source inversion to the USGS Rapid Moment Tensor Solution and to the Harvard CMT solutions, if they are available.
Mw=5.6

2006/04/15 22:40:54    EVID:
LAT: 22.74N, LON: 121.30E, DEPTH:  10
Mw: 5.6, mb: 0.0, Ms: 0.0
Mo=  0.331E+25 (dyne-cm)

No. of Stations:  51, GAP:  84
Error (clvd/dc)*100=  20.91
Bandpass:  12 -  60 sec
Nodal plane parameters
      strike     dip    rake
NP1:     208      46     104
NP2:       8      46      76

             ------------###
          --------------###----
       -------------########------
     -------------###########-------
    ------------##############-------
   -----------################--------
   ----------##################--------
 P ---------###################---------
   --------####################---------
 ---------#####################---------
 --------#########   ##########---------
 --------######### T ##########---------
 -------##########   ##########---------
 -------######################----------
  ------#####################----------
   -----#####################---------
    -----###################---------
     ----##################---------
       ---###############---------
          -############--------
             ########-------


Stat Dist Az Misfit   Stat Dist Az Misfit
ADK   55  41  0.62    ANTO  74 307  0.49
AQU   87 315  0.49    ARU   56 323  0.55
BILL  53  19  0.63    BNI   90 319  0.54
CEL   87 310  0.55    COEN  42 147  0.51
CSS   75 302  0.51    CUC   86 312  0.72
DPC   81 321  0.54    EIDS  55 147  0.37
EKS2  43 308  0.51    FORT  53 172  4.70
GAMB  59  28  0.83    GNI   65 305  0.55
GRFO  85 322  0.56    GVD   82 304  0.51
HLG   84 327  0.60    HNR   49 125  0.87
IBBN  85 325  0.58    ISP   77 305  0.48
KEV   70 338  0.53    KMBL  53 179  0.38
KSDI  74 299  0.70    KURK  43 321  0.57
KWP   78 318  0.53    KZA   42 307  0.63
LAST  81 304  0.54    MALT  70 304  0.55
MORC  81 320  0.57    MSEY  69 255  0.56
PALK  41 254  0.75    PET   41  33  0.63
PMG   40 138  0.60    PSZ   80 318  0.53
RUE   82 323  0.72    SSB   91 320  0.53
SUW   76 323  0.50    TIR   83 312  0.55
TIRR  76 312  0.52    TNA   61  26  0.52
TRF   69  28  0.49    TUE   87 320  0.50
USP   43 309  0.52    VLC   88 317  0.59
VSL   91 314  0.58    VSU   73 326  0.53
WDD   89 308  0.61    WRAB  44 162  0.64
YAK   39   6  0.49
 Misfit > 1 heavily downweighted
|
 TAIWAN REGION
 Epicenter:  22.742  121.301
 MW 5.9

 USGS MOMENT TENSOR SOLUTION
 Depth   8         No. of sta: 26
 Moment Tensor;   Scale 10**17 Nm
   Mrr= 8.54       Mtt= 1.34
   Mff=-9.85       Mrt=-2.61
   Mrf=-0.53       Mtf=-0.51
  Principal axes:
   T  Val=  9.39  Plg=72  Azm=177
   N        0.51      18        4
   P       -9.90       2      273

 Best Double Couple:Mo=9.7*10**17
  NP1:Strike=346 Dip=46 Slip=  65
  NP2:       200     50       114

               #######
          --------###------
        -----------#---------
      -----------#####---------
    -----------########----------
   -----------##########----------
   ----------############---------
  ----------##############---------
   --------################--------
 P --------################--------
   -------#######   #######--------
  --------####### T #######--------
   -------#######   #######-------
   -------#################-------
    ------#################------
      -----###############-----
        ---##############----
          --############---
               #######
|
April 15, 2006, TAIWAN REGION, MW=5.9

Goran Ekstrom

CENTROID, MOMENT TENSOR SOLUTION
HARVARD EVENT-FILE NAME C041506B
DATA USED: GSN
L.P. BODY WAVES: 80S,165C, T= 40
SURFACE WAVES:   74S,164C, T= 50
CENTROID LOCATION:
ORIGIN TIME       22:40:57.3 0.1
LAT 22.85N 0.01;LON 121.37E 0.01
DEP  24.9 0.3;HALF-DURATION  2.2
MOMENT TENSOR; SCALE 10**25 D-CM
  MRR= 0.73 0.01; MTT= 0.08 0.01
  MPP=-0.81 0.01; MRT=-0.28 0.02
  MRP= 0.06 0.02; MTP=-0.26 0.01
 PRINCIPAL AXES:
 1.(T) VAL=  0.85;PLG=68;AZM=194
 2.(N)       0.03;    22;     15
 3.(P)      -0.88;     0;    285
BEST DOUBLE COUPLE:M0=8.7*10**24
 NP1:STRIKE=354;DIP=49;SLIP=  60
 NP2:STRIKE=216;DIP=50;SLIP= 120

            -----######
        ------------#######
      -------------##--------
    ------------#######--------
   -----------##########--------
   ---------############---------
 P --------##############--------
   -------###############---------
 --------#################--------
 -------##################--------
 ------########   ########--------
  -----######## T ########-------
  -----########   #######--------
   ----##################-------
    ---#################-------
      -################------
        ##############-----
            ########---
|
The following broadband stations were used for the source inversion: ADK ANTO AQU ARU BILL BNI CEL COEN CSS CUC DPC EIDS EKS2 FORT GAMB GNI GRFO GVD HLG HNR IBBN ISP KEV KMBL KSDI KURK KWP KZA LAST MALT MORC MSEY PALK PET PMG PSZ RUE SSB SUW TIR TIRR TNA TRF TUE USP VLC VSL VSU WDD WRAB YAK
|
Location of the earthquake (yellow star) and great circle path from the epicenter to each station (red) [created using GMT (Wessel, P., and W. H. F. Smith, New version of Generic Mapping Tools released, EOS Trans. AGU, 76 329, 1995.)] |
All observed and Greens function waveforms are corrected to instrument response to ground velocity in meters/sec for the passband of 0.01 - 5 Hz. Next tre traces were bandpass filtered by the application of the following high- and low-pass stages:
hp c 0.0167 2
lp c 0.0833 2
The traces were next integrated to ground displacment in meters. Finally waveforms were cut from 30 seconds before to 140 seconds after the P arrival so that the direct P wave, pP and perhaps the sP are included.
The source inversion is a multipass operation since a lower frequency filter band is used for larger earthquakes and since a search is made over depth. Up to three passed of the outer loop are made, after which the moment magnitude is determined and filter settings readjusted. The inner loop over depth samples all depths from 0 to 800 km with 5 km increments in depth to 50 km, followed by 10 km depth sampling for the remaining range.
The following filter ranges are used according to the moment magnitude Mw:
   FILTER_BAND   FH(s)  FL(s)
       1           60     12      Mw < 6.4
       2          100     20      6.4 < Mw <= 6.9
       3          120     40      Mw > 6.9
For this data set the favored solution is
WVFMTD96 10.0 208. 46. 104. 5.65 0.385 0.182E-06 0.391 0.639 0.159E-06 20.9
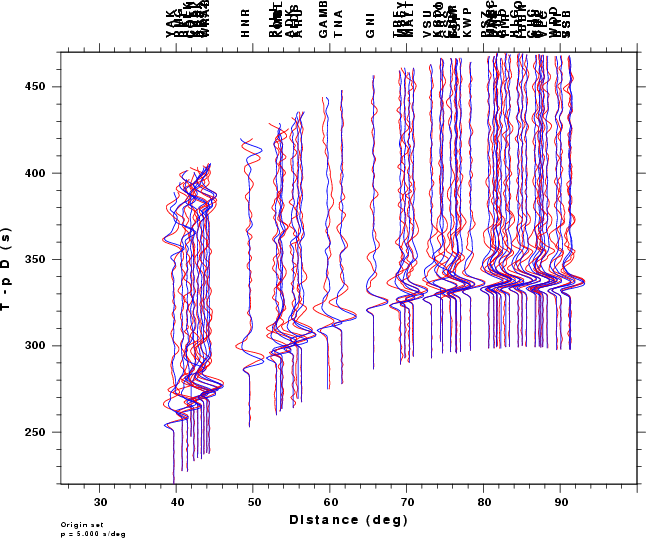
The following figures show the sensitivity of the goodness of fit parameter so source depth, the waveform comparison as a function of epicentral distance in degrees and the source to station azimuth
|
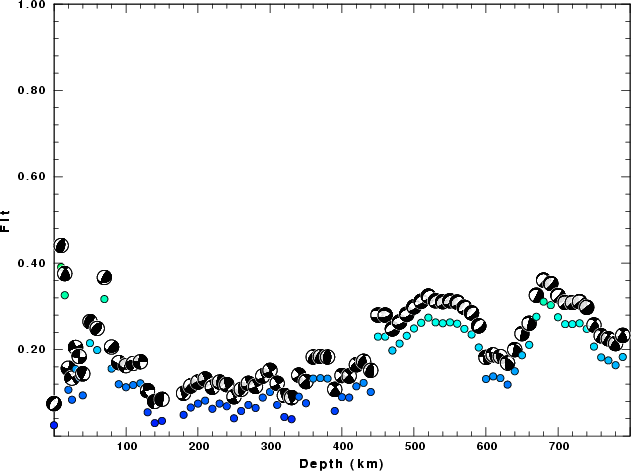
| Goodness of fit as a function of source depth. The measure is 1 - SUM (o -p)2 / SUM o2. A value of 1.0 is the best fit. The best double couple mechanism for the solution depth is plotted above goodness of fit value to indicate how the mefhanism may change with depth. |
|
|
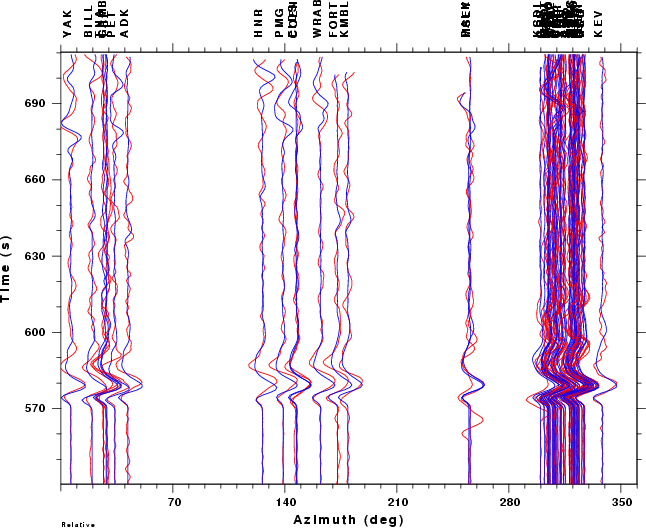
| Comparison of the observed traces (red) and solution predicted traces (blue) as a function of source to station azimuth in degrees (D). The purpose of this display is to highlight the azimuthal dependence on the first motion. The traces are annotated with the station name at the top. |