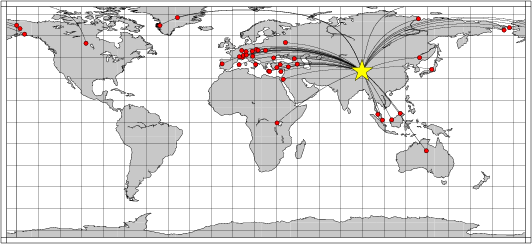
Location of the earthquake (yellow star) and great circle path from the epicenter to each station (red) [created using GMT (Wessel, P., and W. H. F. Smith, New version of Generic Mapping Tools released, EOS Trans. AGU, 76 329, 1995.)]
2006/04/14 09:27:40 35.34 89.71 10
The following compares this source inversion to the USGS Rapid Moment Tensor Solution and to the Harvard CMT solutions, if they are available.
Mw=6.0

2006/04/14 09:27:40    EVID:
LAT: 35.34N, LON:  89.71E, DEPTH:  15
Mw: 6.0, mb: 0.0, Ms: 0.0
Mo=  0.123E+26 (dyne-cm)

No. of Stations:  42, GAP:  92
Error (clvd/dc)*100=   5.63
Bandpass:  12 -  60 sec
Nodal plane parameters
      strike     dip    rake
NP1:     225      88      -9
NP2:     315      81    -178

             ---------------
          ---------------------
       ---------------------------
     ####------------------------###
    #######--------------------######
   ###########---------------#########
  ##############-----------############
 #################-------###############
 ###################----################
   #####################################
 T #################----################
   ###############-------###############
 ###############-----------#############
 #############---------------###########
  ###########-----------------#########
   ########--------------------#######
    #####------------------------####
     ###--------------------------##
       ---------------------------
          ---------   ---------
             ------ P ------


Stat Dist Az Misfit   Stat Dist Az Misfit
ANTO  44 293  1.43    BMR   74  24  0.98
BNI   61 306  1.09    BTDF  36 155  5.02
COLA  70  22  1.10    COLD  68  21  0.85
CSS   45 286  2.96    CUC   57 298  0.70
DPC   53 310  1.38    EIL   46 279  0.82
FFC   89   6  1.18    GAMB  62  29  0.98
GNI   35 291  2.07    IDI   51 290  1.90
ISP   46 291  1.84    KHC   55 309  0.77
KIV   36 298  3.96    KKM   38 133  0.36
KSM   38 145  0.86    KUM   31 158  0.94
KWP   49 308  1.28    LAST  51 289  2.53
MAHO  65 302  1.05    MAJO  38  73  2.46
MALT  40 289  0.85    MBAR  65 250  1.55
MDJ   31  60  1.82    MORC  53 309  1.19
MTE   72 307  0.94    OBN   41 315  1.26
SENI  60 308  0.80    SFJD  73 344  2.01
SSB   62 307  0.95    STU   58 310  0.76
SUMG  66 345  2.98    TIRR  46 300  1.97
TIXI  41  17 15.00    TNA   63  27  0.87
TRI   56 305  2.04    TUE   59 307  1.25
WLF   60 311  0.92    WRAB  69 135  0.55
 Misfit > 1 heavily downweighted
|
 06/04/14 09:27:40.75
 WESTERN XIZANG
 Epicenter:  35.344   89.706
 MW 5.6

 USGS MOMENT TENSOR SOLUTION
 Depth   5         No. of sta: 22
 Moment Tensor;   Scale 10**17 Nm
   Mrr=-3.11       Mtt= 2.09
   Mff= 1.02       Mrt= 0.15
   Mrf= 0.04       Mtf= 1.90
  Principal axes:
   T  Val=  3.53  Plg= 1  Azm=323
   N       -0.42       1       53
   P       -3.11      88      186

 Best Double Couple:Mo=3.3*10**17
  NP1:Strike= 52 Dip=44 Slip= -92
  NP2:       234     46       -88

               #######
          #################
        T ###################
      #   #####################
    ##############--------------#
   ############-----------------##
   #########--------------------##
  ########---------------------####
  #######--------   -----------####
  ######--------- P ----------#####
  #####----------   ---------######
  ####---------------------########
   ##--------------------#########
   ##------------------###########
    #---------------#############
      #--------################
        #####################
          #################
               #######
|
pril 14, 2006, WESTERN XIZANG, MW=5.6

Goran Ekstrom

CENTROID, MOMENT TENSOR SOLUTION
HARVARD EVENT-FILE NAME C041406A
DATA USED: GSN
L.P. BODY WAVES: 49S, 90C, T= 40
SURFACE WAVES:   64S,132C, T= 50
CENTROID LOCATION:
ORIGIN TIME       09:27:47.5 0.1
LAT 35.45N 0.01;LON  89.71E 0.01
DEP  17.3 0.5;HALF-DURATION  1.6
MOMENT TENSOR; SCALE 10**24 D-CM
  MRR=-2.27 0.07; MTT=-0.98 0.06
  MPP= 3.25 0.06; MRT= 0.45 0.16
  MRP= 0.67 0.16; MTP= 2.28 0.05
 PRINCIPAL AXES:
 1.(T) VAL=  4.34;PLG= 7;AZM=294
 2.(N)      -1.93;    18;     26
 3.(P)      -2.41;    70;    184
BEST DOUBLE COUPLE:M0=3.4*10**24
 NP1:STRIKE=  4;DIP=41;SLIP=-118
 NP2:STRIKE=220;DIP=54;SLIP= -67

            ########---
        ##############-----
      ################--#####
    ##############-------######
     ###########----------######
   T #########------------#######
     #######---------------######
 ##########----------------#######
 ########------------------#######
 ########------------------#######
 #######--------   --------#######
  #####--------- P -------#######
  #####---------   -------#######
   ####------------------#######
    ###-----------------#######
      #----------------######
        -------------######
            ------#####
|
The following broadband stations were used for the source inversion: ANTO BMR BNI BTDF COLA COLD CSS CUC DPC EIL FFC GAMB GNI IDI ISP KHC KIV KKM KSM KUM KWP LAST MAHO MAJO MALT MBAR MDJ MORC MTE OBN SENIN SFJD SSB STU SUMG TIRR TIXI TNA TRI TUE WLF WRAB
|
Location of the earthquake (yellow star) and great circle path from the epicenter to each station (red) [created using GMT (Wessel, P., and W. H. F. Smith, New version of Generic Mapping Tools released, EOS Trans. AGU, 76 329, 1995.)] |
All observed and Greens function waveforms are corrected to instrument response to ground velocity in meters/sec for the passband of 0.01 - 5 Hz. Next tre traces were bandpass filtered by the application of the following high- and low-pass stages:
hp c 0.0167 2
lp c 0.0833 2
br c 0.12 0.25 n 4 p 2
br c 0.12 0.25 n 4 p 2
The traces were next integrated to ground displacment in meters. Finally waveforms were cut from 30 seconds before to 140 seconds after the P arrival so that the direct P wave, pP and perhaps the sP are included.
The source inversion is a multipass operation since a lower frequency filter band is used for larger earthquakes and since a search is made over depth. Up to three passed of the outer loop are made, after which the moment magnitude is determined and filter settings readjusted. The inner loop over depth samples all depths from 0 to 800 km with 5 km increments in depth to 50 km, followed by 10 km depth sampling for the remaining range.
The following filter ranges are used according to the moment magnitude Mw:
   FILTER_BAND   FH(s)  FL(s)
       1           60     12      Mw < 6.4
       2          100     20      6.4 < Mw <= 6.9
       3          120     40      Mw > 6.9
For this data set the favored solution is
WVFMTD96 15.0 225. 88. -9. 6.03 0.088 0.296E-06 0.136 0.332 0.199E-06 5.6
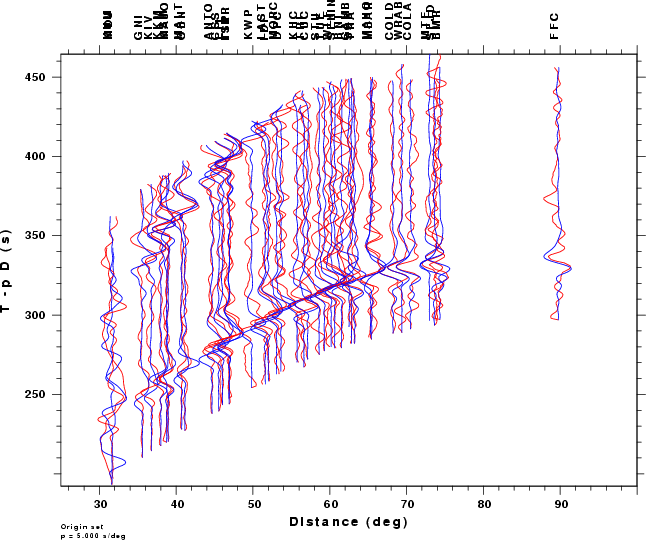
The following figures show the sensitivity of the goodness of fit parameter so source depth, the waveform comparison as a function of epicentral distance in degrees and the source to station azimuth
|
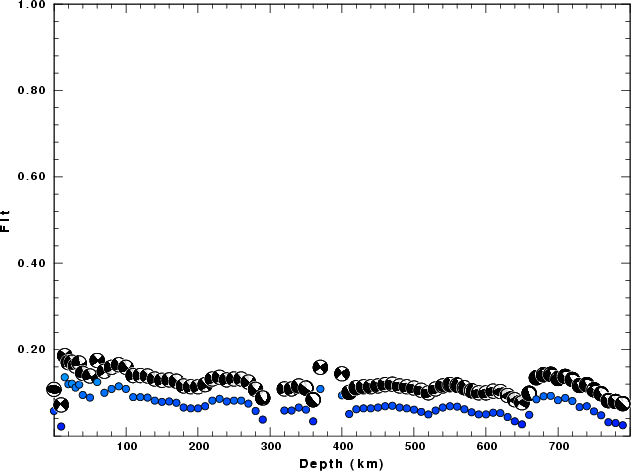
| Goodness of fit as a function of source depth. The measure is 1 - SUM (o -p)2 / SUM o2. A value of 1.0 is the best fit. The best double couple mechanism for the solution depth is plotted above goodness of fit value to indicate how the mefhanism may change with depth. |
|
|
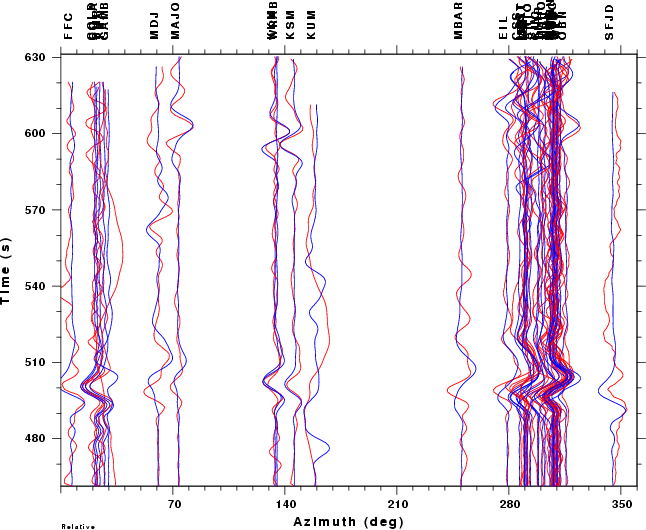
| Comparison of the observed traces (red) and solution predicted traces (blue) as a function of source to station azimuth in degrees (D). The purpose of this display is to highlight the azimuthal dependence on the first motion. The traces are annotated with the station name at the top. |