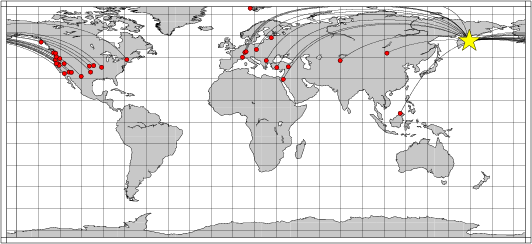
Location of the earthquake (yellow star) and great circle path from the epicenter to each station (red) [created using GMT (Wessel, P., and W. H. F. Smith, New version of Generic Mapping Tools released, EOS Trans. AGU, 76 329, 1995.)]
2006/04/12 01:06:59 56.26 164.15 20
The following compares this source inversion to the USGS Rapid Moment Tensor Solution and to the Harvard CMT solutions, if they are available.
Mw=5.9

2006/04/12 01:06:59    EVID:
LAT: 56.26N, LON: 164.15E, DEPTH:  10
Mw: 5.9, mb: 0.0, Ms: 0.0
Mo=  0.709E+25 (dyne-cm)

No. of Stations:  32, GAP: 158
Error (clvd/dc)*100=  20.11
Bandpass:  12 -  60 sec
Nodal plane parameters
      strike     dip    rake
NP1:     294      88     162
NP2:      25      72       2

                ------------
          --- P -------------##
       ------   -------------#####
     ------------------------#######
    -------------------------########
   -------------------------##########
  ###-----------------------###########
 ########------------------#############
 #############-------------#############
 #################--------##############
 #####################---###############
 #######################--##############
 ##   #################-------##########
 ## T #################----------#######
  #   ###############----------------##
   #################------------------
    ###############------------------
     #############------------------
       #########------------------
          ####-----------------
             ---------------


Stat Dist Az Misfit   Stat Dist Az Misfit
AAK   55 296  0.76    ACCN  69  41  0.92
BFO   73 343  0.80    BMN   51  72  0.88
BNI   77 343  0.93    C03A  42  69  0.52
C04A  43  69  0.33    CBKS  61  61  0.57
CCM   66  56  0.58    CRAG  34  64  0.42
DBO   46  74  0.92    DGR   56  78  0.82
DPC   70 338  0.83    EIL   84 317  0.98
G04A  45  71  0.69    I06A  47  71  0.74
ISP   78 324  0.82    KBS   44 352  0.57
KKM   62 236  0.50    KSU1  63  59  0.81
MALT  75 318  0.80    MNTX  64  70  0.60
O04C  49  75  0.87    P05C  50  75  0.90
STU   73 342  0.84    ULN   35 280  0.79
VSU   60 335  0.66    VTS   76 331  0.78
WDC   48  76  0.93    WMOK  65  63  0.52
X13A  57  74  0.75    X15A  58  73  0.67
 Misfit > 1 heavily downweighted
|
MANDORSKIYE OSTROVA REGION

2006/04/12 01:06:59.45    EVID: LKAC
LAT: 56.26N, LON: 164.15E, DEPTH:  20
Mw: 5.8, mb: 5.8, Ms: 5.8
Mo=  0.548E+25 (dyne-cm)

No. of Stations:   4, GAP: 254
Error (clvd/dc)*100=  93.80

Nodal plane parameters
      strike     dip    rake
NP1:     358      45     -53
NP2:     131      56     239

                ------####
           -------------#######
        ------------------########
      ----------------------########
     #-----------------------########
    ##------------------------########
   ###------------------------#########
  #####------------------------#########
  #####------------------------#########
 #######------------------------#########
 ########-----------------------#########
 ##########---------------------#########
 ###########--------------------#########
  ############-----------------#########
  ##############---------------#########
   ###############-------------########
    #################---------########
     ####################----########
      ######################--------
        ###################-------
           ##############------
                #######---

Stat Dist Az Misfit   Stat Dist Az Misfit
EIL   84 317  0.95    INK   29  41  0.54
KBS   44 352  0.84    SIT   32  62  0.70

Median of misfit:  0.77
  Average misfit:  0.76
|
April 12, 2006, KOMANDORSKIYE OSTROVA REGION, MW=6.0

Natasha Maternovskaya

CENTROID, MOMENT TENSOR SOLUTION
HARVARD EVENT-FILE NAME C041206A
DATA USED: GSN
L.P. BODY WAVES: 77S,185C, T= 40
MANTLE WAVES:    71S,117C, T=125
CENTROID LOCATION:
ORIGIN TIME       01:07: 1.6 0.1
LAT 56.18N 0.02;LON 164.27E 0.02
DEP  39.1 1.4;HALF-DURATION  2.5
MOMENT TENSOR; SCALE 10**25 D-CM
  MRR= 0.04 0.01; MTT=-0.62 0.02
  MPP= 0.58 0.02; MRT= 0.00 0.03
  MRP= 0.17 0.03; MTP=-1.19 0.01
 PRINCIPAL AXES:
 1.(T) VAL=  1.33;PLG= 7;AZM=239
 2.(N)       0.03;    82;     28
 3.(P)      -1.36;     4;    148
BEST DOUBLE COUPLE:M0=1.3*10**25
 NP1:STRIKE=283;DIP=83;SLIP= 178
 NP2:STRIKE= 14;DIP=88;SLIP=   7

            ---------##
        -------------######
      ---------------########
    ----------------###########
   -----------------############
  -----------------##############
  -----------------##############
 ###########-------###############
 #################--##############
 #################--------########
 ################--------------###
  ###############----------------
  #   ##########-----------------
    T ##########----------------
      #########----------------
      #########---------   --
        ######---------- P
            ##---------
|
The following broadband stations were used for the source inversion: AAK ACCN BFO BMN BNI C03A C04A CBKS CCM CRAG DBO DGR DPC EIL G04A I06A ISP KBS KKM KSU1 MALT MNTX O04C P05C STU ULN VSU VTS WDC WMOK X13A X15A
|
Location of the earthquake (yellow star) and great circle path from the epicenter to each station (red) [created using GMT (Wessel, P., and W. H. F. Smith, New version of Generic Mapping Tools released, EOS Trans. AGU, 76 329, 1995.)] |
All observed and Greens function waveforms are corrected to instrument response to ground velocity in meters/sec for the passband of 0.01 - 5 Hz. Next tre traces were bandpass filtered by the application of the following high- and low-pass stages:
hp c 0.0167 2
lp c 0.0833 2
br c 0.12 0.25 n 4 p 2
The traces were next integrated to ground displacment in meters. Finally waveforms were cut from 30 seconds before to 140 seconds after the P arrival so that the direct P wave, pP and perhaps the sP are included.
The source inversion is a multipass operation since a lower frequency filter band is used for larger earthquakes and since a search is made over depth. Up to three passed of the outer loop are made, after which the moment magnitude is determined and filter settings readjusted. The inner loop over depth samples all depths from 0 to 800 km with 5 km increments in depth to 50 km, followed by 10 km depth sampling for the remaining range.
The following filter ranges are used according to the moment magnitude Mw:
   FILTER_BAND   FH(s)  FL(s)
       1           60     12      Mw < 6.4
       2          100     20      6.4 < Mw <= 6.9
       3          120     40      Mw > 6.9
For this data set the favored solution is
WVFMTD96 10.0 294. 88. 162. 5.87 0.143 0.197E-06 0.210 0.382 0.820E-07 20.1
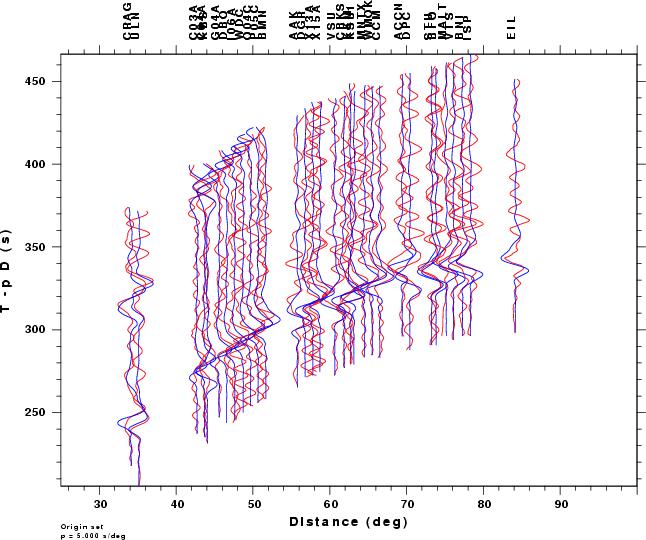
The following figures show the sensitivity of the goodness of fit parameter so source depth, the waveform comparison as a function of epicentral distance in degrees and the source to station azimuth
|
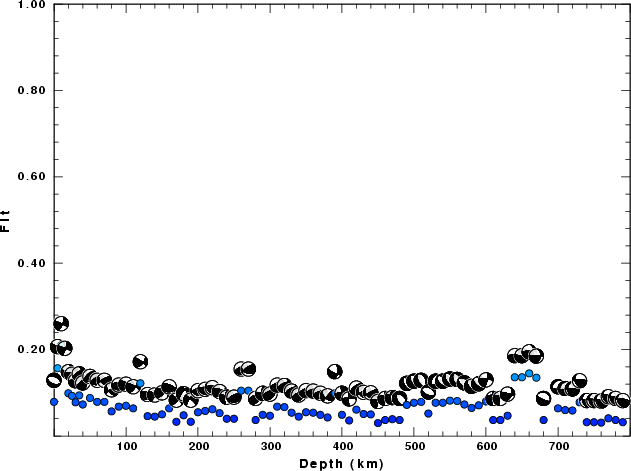
| Goodness of fit as a function of source depth. The measure is 1 - SUM (o -p)2 / SUM o2. A value of 1.0 is the best fit. The best double couple mechanism for the solution depth is plotted above goodness of fit value to indicate how the mefhanism may change with depth. |
|
|
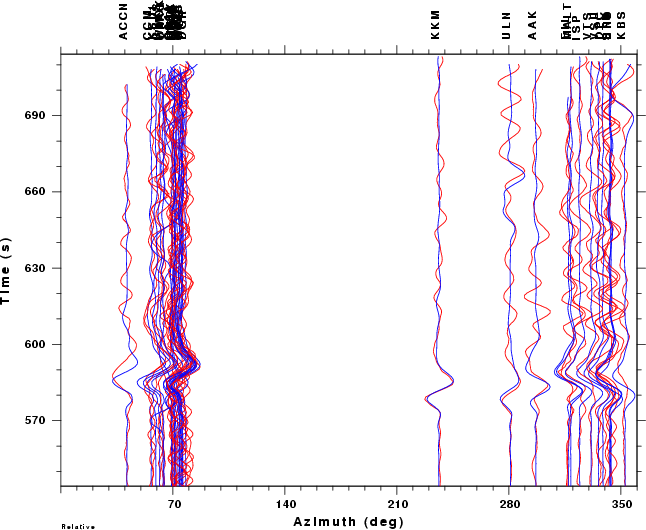
| Comparison of the observed traces (red) and solution predicted traces (blue) as a function of source to station azimuth in degrees (D). The purpose of this display is to highlight the azimuthal dependence on the first motion. The traces are annotated with the station name at the top. |