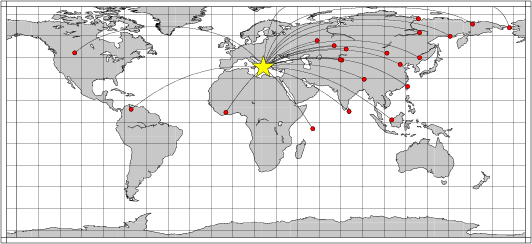
Location of the earthquake (yellow star) and great circle path from the epicenter to each station (red) [created using GMT (Wessel, P., and W. H. F. Smith, New version of Generic Mapping Tools released, EOS Trans. AGU, 76 329, 1995.)]
2006/04/11 17:29:29 37.96 21.23 10
The following compares this source inversion to the USGS Rapid Moment Tensor Solution and to the Harvard CMT solutions, if they are available.
Mw=5.5

2006/04/11 17:29:29    EVID:
LAT: 37.96N, LON:  21.23E, DEPTH:  15
Mw: 5.5, mb: 0.0, Ms: 0.0
Mo=  0.231E+25 (dyne-cm)

No. of Stations:  21, GAP:  88
Error (clvd/dc)*100=   9.51
Bandpass:  12 -  60 sec
Nodal plane parameters
      strike     dip    rake
NP1:     357      73    -133
NP2:     249      46     -25

             #######--------
          ###########----------
       ###############------------
     ##################-------------
    #################--########------
   ############---------############--
  ##########------------###############
 ########---------------################
 ######-----------------################
 #####-------------------###############
 ###---------------------###############
 ##----------------------###############
 ##----------------------###############
 #---------   -----------#########   ###
  --------- P -----------######### T ##
   --------   ----------##########   #
    --------------------#############
     -------------------############
       -----------------##########
          -------------########
             ---------######


Stat Dist Az Misfit   Stat Dist Az Misfit
ARU   30  41  0.50    BILL  71  13  0.93
BJT   70  54  0.63    BRVK  36  49  0.64
DBIC  39 223  4.42    EGMT  83 329  0.80
KSM   88  89  0.73    KURK  41  53  0.37
LSA   57  75  0.44    MA2   74  24  0.60
MDJ   75  44  0.97    MSEY  53 135  0.86
PALK  61 103  0.59    SDV   86 278  2.34
TIXI  59  20  0.64    TKM2  41  65  0.33
TNA   76   3  0.94    ULN   60  50  0.44
USP   40  65  0.36    YAK   65  29  0.60
YHNB  82  64  0.87
 Misfit > 1 heavily downweighted
|
April 11, 2006, SOUTHERN GREECE, MW=5.5

Natasha Maternovskaya

CENTROID, MOMENT TENSOR SOLUTION
HARVARD EVENT-FILE NAME C041106B
DATA USED: GSN
L.P. BODY WAVES: 58S,101C, T= 40
SURFACE WAVES:   75S,166C, T= 50
CENTROID LOCATION:
ORIGIN TIME       17:29:35.3 0.2
LAT 37.66N 0.02;LON  20.84E 0.01
DEP  21.1 0.8;HALF-DURATION  1.4
MOMENT TENSOR; SCALE 10**24 D-CM
  MRR= 1.44 0.06; MTT= 1.31 0.05
  MPP=-2.76 0.05; MRT= 0.36 0.09
  MRP=-0.90 0.09; MTP=-0.11 0.04
 PRINCIPAL AXES:
 1.(T) VAL=  1.87;PLG=55;AZM= 17
 2.(N)       1.06;    33;    173
 3.(P)      -2.95;    12;    270
BEST DOUBLE COUPLE:M0=2.4*10**24
 NP1:STRIKE= 35;DIP=44;SLIP= 141
 NP2:STRIKE=155;DIP=64;SLIP=  53

            ###########
        --#################
      ----##################-
    ------##################---
   -------########   ########---
  --------######## T ########----
  --------########   ########----
    -------#################------
  P -------#################------
    --------###############-------
 ------------#############--------
  ------------###########--------
  -------------#########---------
   -------------######----------
    --------------##-----------
      -----------###---------
        ##############-----
            ###########
|
Date   6  4 11  Time 17 29 27.2
 Loc    37.72   20.94  18. Dur  9.0
SED http://www.seismo.ethz.ch/mt/armt/all_armt.html
 ScMom    0.361E+25   Mw  5.64
 MT   0.174E+25  0.148E+25 -0.322E+25 -0.239E+25  0.896E+23  0.679E+23
 Err  0.777E+23  0.469E+23  0.528E+23  0.869E+23  0.954E+23  0.494E+23
 Principal Axes:
 T -   val  0.400E+01   plg   46  azi  180
 N -       -0.773E+00         43       356
 P -       -0.323E+01          1        88
 Best Double Couple:
 NP1 -  str  213  dip 57  slp  144
 NP2 -       324      60        37
 Isotropic component            0.000
 Deviation from Double Couple   0.193

 Freq range  0.0100 0.020


            ##########
         ****#######*****
       ------**   **-------
     ---------- n -----------
    -----------   ------------
   -----------**-**------------
   ----------*--#--**----------
  ----------*########*--------
  ---------*##########*------- p
  --------*############*------
  -------*##############*-------
   -----#*##############*#-----
   -----*######   #######*-----
    ----*###### t #######*----
     ---*######   #######*---
       -*################*-
         ################
            ##########
|
The following broadband stations were used for the source inversion: ARU BILL BJT BRVK DBIC EGMT KSM KURK LSA MA2 MDJ MSEY PALK SDV TIXI TKM2 TNA ULN USP YAK YHNB
|
Location of the earthquake (yellow star) and great circle path from the epicenter to each station (red) [created using GMT (Wessel, P., and W. H. F. Smith, New version of Generic Mapping Tools released, EOS Trans. AGU, 76 329, 1995.)] |
All observed and Greens function waveforms are corrected to instrument response to ground velocity in meters/sec for the passband of 0.01 - 5 Hz. Next tre traces were bandpass filtered by the application of the following high- and low-pass stages:
hp c 0.0167 2
lp c 0.0833 2
The traces were next integrated to ground displacment in meters. Finally waveforms were cut from 30 seconds before to 140 seconds after the P arrival so that the direct P wave, pP and perhaps the sP are included.
The source inversion is a multipass operation since a lower frequency filter band is used for larger earthquakes and since a search is made over depth. Up to three passed of the outer loop are made, after which the moment magnitude is determined and filter settings readjusted. The inner loop over depth samples all depths from 0 to 800 km with 5 km increments in depth to 50 km, followed by 10 km depth sampling for the remaining range.
The following filter ranges are used according to the moment magnitude Mw:
   FILTER_BAND   FH(s)  FL(s)
       1           60     12      Mw < 6.4
       2          100     20      6.4 < Mw <= 6.9
       3          120     40      Mw > 6.9
For this data set the favored solution is
WVFMTD96 15.0 357. 73. -133. 5.54 0.228 0.110E-06 0.417 0.490 0.526E-07 9.5
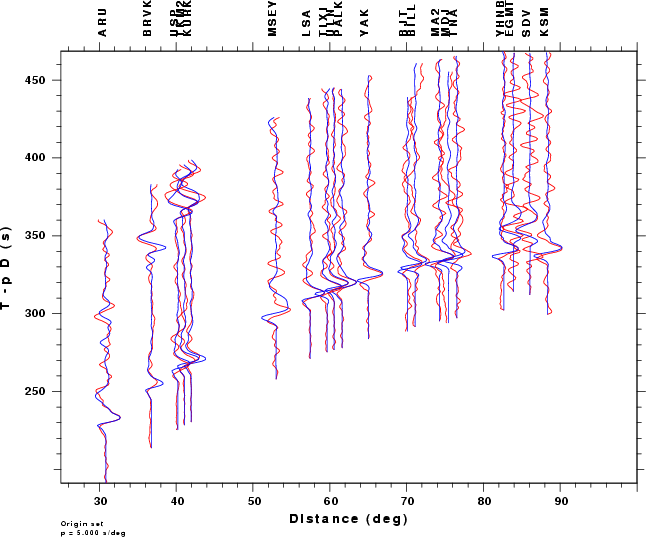
The following figures show the sensitivity of the goodness of fit parameter so source depth, the waveform comparison as a function of epicentral distance in degrees and the source to station azimuth
|
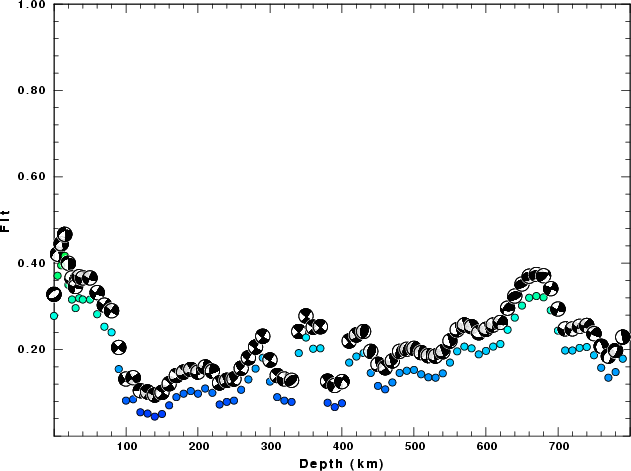
| Goodness of fit as a function of source depth. The measure is 1 - SUM (o -p)2 / SUM o2. A value of 1.0 is the best fit. The best double couple mechanism for the solution depth is plotted above goodness of fit value to indicate how the mefhanism may change with depth. |
|
|
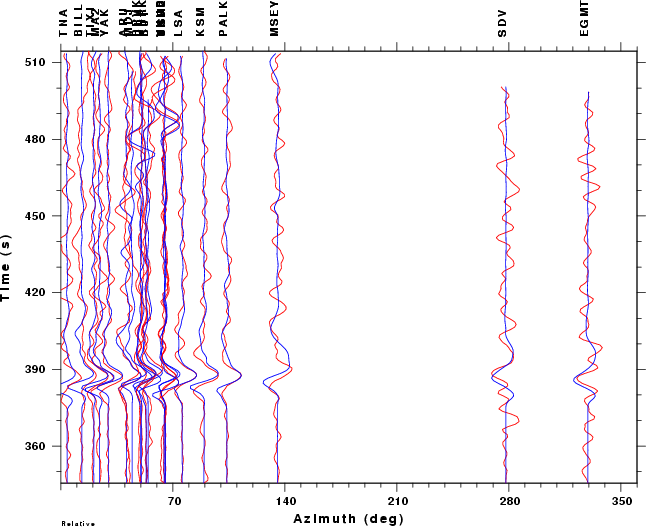
| Comparison of the observed traces (red) and solution predicted traces (blue) as a function of source to station azimuth in degrees (D). The purpose of this display is to highlight the azimuthal dependence on the first motion. The traces are annotated with the station name at the top. |