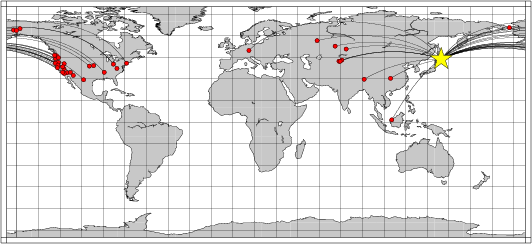
Location of the earthquake (yellow star) and great circle path from the epicenter to each station (red) [created using GMT (Wessel, P., and W. H. F. Smith, New version of Generic Mapping Tools released, EOS Trans. AGU, 76 329, 1995.)]
2006/04/10 11:25:59 43.74 144.68 121
The following compares this source inversion to the USGS Rapid Moment Tensor Solution and to the Harvard CMT solutions, if they are available.
Mw=6.4

2006/04/10 11:25:59    EVID:
LAT: 43.74N, LON: 144.68E, DEPTH: 240
Mw: 6.4, mb: 0.0, Ms: 0.0
Mo=  0.434E+26 (dyne-cm)

No. of Stations:  37, GAP: 166
Error (clvd/dc)*100=  51.60
Bandpass:  12 -  60 sec
Nodal plane parameters
      strike     dip    rake
NP1:      43      85    -170
NP2:     312      80      -5

             ###############
          #####################
       ###########################
     --##########################---
    ------######################-----
   ----------#################--------
  --------------#############----------
 -----------------#########-------------
 -------------------######--------------
    ------------------##----------------
  P ------------------##----------------
    -----------------#####--------------
 ------------------#########------------
 ----------------############-----------
  -------------################--------
   ----------###################------
    -------#######################---
     ----##########################-
       ###########################
          ##########   ########
             ####### T #####


Stat Dist Az Misfit   Stat Dist Az Misfit
ACSO  86  34  0.94    AML   50 294  3.43
ARU   53 316  3.13    BLA   89  34  0.96
BMN   68  54  1.07    CBKS  79  45  0.98
CHUM  40  37  0.99    COLA  42  36  1.00
ENH   30 256  4.60    EUO   62  54  0.84
F04A  62  52  0.92    FOR   88  28  0.97
GRA   70  57  0.97    GRFO  78 331  1.25
H05A  63  52  0.99    IRM   73  58  1.04
KSM   52 225  1.14    KSU1  80  43  0.93
KURK  44 303 10.31    LSA   44 270  9.18
LTX   84  54  0.98    M05C  65  55  1.01
MEGW  61  52  0.97    MUR   72  59  0.98
N02C  64  57  1.10    ORV   66  57  1.08
OXF   87  42  0.97    R08A  69  56  0.95
TKM2  48 294  2.47    TNA   33  33  1.23
TRF   41  38  0.97    TUC   77  57  0.89
UCH   49 294  1.44    VCS   71  59  0.90
VOS   47 308  2.21    WENL  67  59  0.97
X14A  74  56  1.02
 Misfit > 1 heavily downweighted
|
April 10, 2006, HOKKAIDO, JAPAN REGION, MW=5.1

Natasha Maternovskaya

CENTROID, MOMENT TENSOR SOLUTION
HARVARD EVENT-FILE NAME C041006B
DATA USED: GSN
L.P. BODY WAVES: 31S, 37C, T= 40
SURFACE WAVES:   51S,100C, T= 50
CENTROID LOCATION:
ORIGIN TIME       11:26: 1.3 0.3
LAT 43.74N 0.02;LON 144.84E 0.03
DEP 128.4 2.7;HALF-DURATION  0.9
MOMENT TENSOR; SCALE 10**23 D-CM
  MRR= 3.17 0.19; MTT= 1.58 0.20
  MPP=-4.75 0.21; MRT= 0.33 0.13
  MRP=-3.41 0.16; MTP=-2.32 0.18
 PRINCIPAL AXES:
 1.(T) VAL=  4.87;PLG=58;AZM= 47
 2.(N)       1.68;    25;    186
 3.(P)      -6.54;    18;    285
BEST DOUBLE COUPLE:M0=5.7*10**23
 NP1:STRIKE= 49;DIP=35;SLIP= 138
 NP2:STRIKE=175;DIP=68;SLIP=  63

            ----#######
        -------############
      --------###############
    ----------################-
   ----------##################-
  -----------########   #######--
  -   -------######## T #######--
 -- P -------########   #######---
 --   -------#################----
 ------------#################----
 ------------################-----
  ------------##############-----
  ------------############-------
   -----------##########--------
    -----------#######---------
      #---------##-----------
        #########----------
            ######-----
|
The following broadband stations were used for the source inversion: ACSO AML ARU BLA BMN CBKS CHUM COLA ENH EUO F04A FOR GRA GRFO H05A IRM KSM KSU1 KURK LSA LTX M05C MEGW MUR N02C ORV OXF R08A TKM2 TNA TRF TUC UCH VCS VOS WENL X14A
|
Location of the earthquake (yellow star) and great circle path from the epicenter to each station (red) [created using GMT (Wessel, P., and W. H. F. Smith, New version of Generic Mapping Tools released, EOS Trans. AGU, 76 329, 1995.)] |
All observed and Greens function waveforms are corrected to instrument response to ground velocity in meters/sec for the passband of 0.01 - 5 Hz. Next tre traces were bandpass filtered by the application of the following high- and low-pass stages:
hp c 0.0167 2
lp c 0.0833 2
br c 0.12 0.25 n 4 p 2
The traces were next integrated to ground displacment in meters. Finally waveforms were cut from 30 seconds before to 140 seconds after the P arrival so that the direct P wave, pP and perhaps the sP are included.
The source inversion is a multipass operation since a lower frequency filter band is used for larger earthquakes and since a search is made over depth. Up to three passed of the outer loop are made, after which the moment magnitude is determined and filter settings readjusted. The inner loop over depth samples all depths from 0 to 800 km with 5 km increments in depth to 50 km, followed by 10 km depth sampling for the remaining range.
The following filter ranges are used according to the moment magnitude Mw:
   FILTER_BAND   FH(s)  FL(s)
       1           60     12      Mw < 6.4
       2          100     20      6.4 < Mw <= 6.9
       3          120     40      Mw > 6.9
For this data set the favored solution is
WVFMTD96 240.0 43. 85. -170. 6.39 -0.028 0.100E-05 0.077 0.134 0.209E-06 51.6
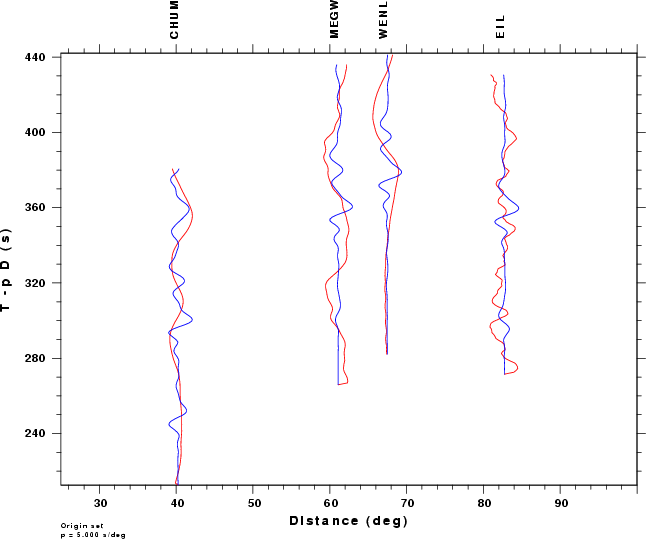
The following figures show the sensitivity of the goodness of fit parameter so source depth, the waveform comparison as a function of epicentral distance in degrees and the source to station azimuth
|
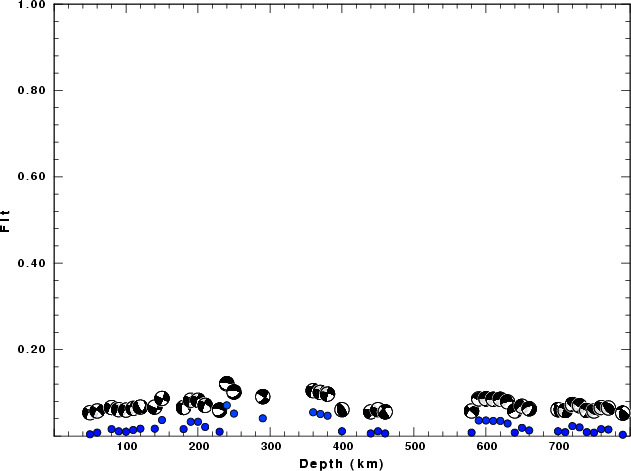
| Goodness of fit as a function of source depth. The measure is 1 - SUM (o -p)2 / SUM o2. A value of 1.0 is the best fit. The best double couple mechanism for the solution depth is plotted above goodness of fit value to indicate how the mefhanism may change with depth. |
|
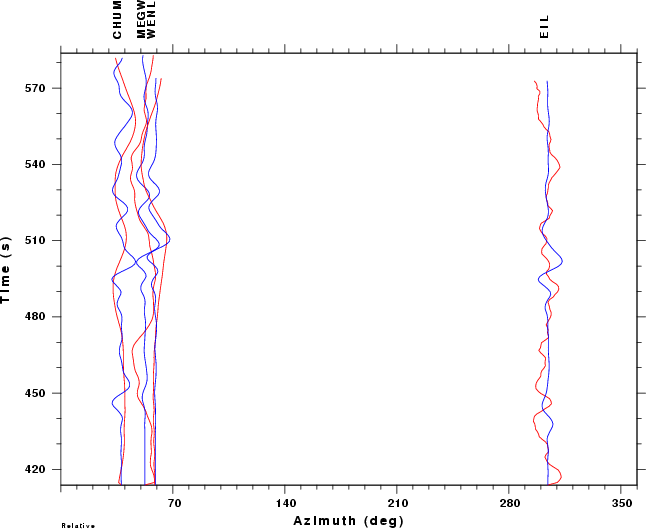
|
| Comparison of the observed traces (red) and solution predicted traces (blue) as a function of source to station azimuth in degrees (D). The purpose of this display is to highlight the azimuthal dependence on the first motion. The traces are annotated with the station name at the top. |