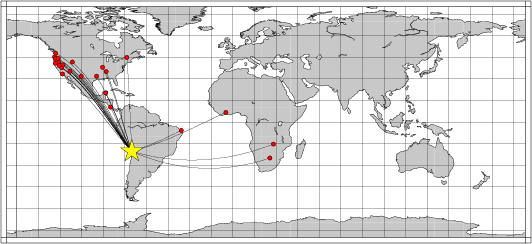
Location of the earthquake (yellow star) and great circle path from the epicenter to each station (red) [created using GMT (Wessel, P., and W. H. F. Smith, New version of Generic Mapping Tools released, EOS Trans. AGU, 76 329, 1995.)]
2006/04/09 20:50:46 -20.39 -70.20 34
The following compares this source inversion to the USGS Rapid Moment Tensor Solution and to the Harvard CMT solutions, if they are available.
Mw=5.9

2006/04/09 20:50:46    EVID:
LAT: 20.39S, LON:  70.20W, DEPTH:  35
Mw: 5.9, mb: 0.0, Ms: 0.0
Mo=  0.731E+25 (dyne-cm)

No. of Stations:  23, GAP: 203
Error (clvd/dc)*100=  82.39
Bandpass:  12 -  60 sec
Nodal plane parameters
      strike     dip    rake
NP1:     250      74     155
NP2:     348      66      18

             ----###########
          ---------############
       --------------#############
     -----------------##############
      -----------------##############
    P ------------------##############
  -   ------------------###############
 ---------------------------------------
 ------------------#######--------------
 --------------###########--------------
 ----------################-------------
 -------###################-------------
 ----######################-------------
 --########################-------------
  #########################------------
   ########################-----------
    #########   ###########----------
     ######## T ###########---------
       ######   ###########-------
          ################-----
             ############---


Stat Dist Az Misfit   Stat Dist Az Misfit
C04A  82 327  0.43    CIA   70 318  0.92
DBIC  69  74  0.16    FRNY  64 357  0.49
FVM   61 341  0.59    HEBO  81 324  0.96
HWUT  72 328  0.23    I03A  80 324  0.33
I05A  79 325  0.24    JTS   33 333  0.57
LBTB  86 115  0.25    LSZ   92 107  0.19
M05C  77 323  0.31    MLAC  73 321  0.95
MNTX  61 326  0.26    N02C  78 321  1.59
NATX  56 335  0.31    P05C  75 321  0.36
P08A  74 323  0.31    PLAL  57 342  0.71
RCBR  36  71  0.36    TEIG  44 335  0.55
W14A  68 323  0.30
 Misfit > 1 heavily downweighted
|
06/04/09 20:50:46.27
 OFFSHORE TARAPACA, CHILE
 Epicenter: -20.389  -70.198
 MW 5.8

 USGS MOMENT TENSOR SOLUTION
 Depth  36         No. of sta: 11
 Moment Tensor;   Scale 10**17 Nm
   Mrr= 5.04       Mtt=-3.66
   Mff=-1.38       Mrt=-1.64
   Mrf=-1.48       Mtf=-2.27
  Principal axes:
   T  Val=  5.52  Plg=78  Azm=129
   N       -0.01       4      237
   P       -5.50      12      327

 Best Double Couple:Mo=5.5*10**17
  NP1:Strike= 63 Dip=34 Slip=  97
  NP2:       234     57        85

               -------
            ---------------
        - P -----------------
      ---   -------------------
    -------------------##########
   ----------------###############
   -------------##################
  -----------####################--
  ---------######################--
  -------##########   ##########---
  ------########### T #########----
  -----############   ########-----
   ---#######################-----
   --######################-------
    ####################---------
      ----#########------------
        ---------------------
          -----------------
               -------
|
April 9, 2006, OFFSHORE TARAPACA, CHILE, MW=5.7

Natasha Maternovskaya

CENTROID, MOMENT TENSOR SOLUTION
HARVARD EVENT-FILE NAME C040906A
DATA USED: GSN
L.P. BODY WAVES: 73S,152C, T= 40
SURFACE WAVES:   75S,158C, T= 50
CENTROID LOCATION:
ORIGIN TIME       20:50:51.1 0.2
LAT 20.48S 0.01;LON  70.78W 0.02
DEP  38.7 0.6;HALF-DURATION  1.8
MOMENT TENSOR; SCALE 10**24 D-CM
  MRR= 3.86 0.09; MTT=-1.50 0.07
  MPP=-2.37 0.09; MRT=-0.98 0.08
  MRP=-2.36 0.11; MTP=-2.11 0.06
 PRINCIPAL AXES:
 1.(T) VAL=  4.66;PLG=72;AZM= 99
 2.(N)       0.12;     8;    214
 3.(P)      -4.79;    16;    307
BEST DOUBLE COUPLE:M0=4.7*10**24
 NP1:STRIKE= 49;DIP=30;SLIP= 106
 NP2:STRIKE=210;DIP=61;SLIP=  81

            -----------
        ----------------###
      ---------------########
    -   ----------############-
   -- P --------###############-
  ---   -------################--
  ------------#################--
 -----------###################---
 ----------#########   ########---
 ----------######### T #######----
 ---------##########   #######----
  -------####################----
  -------##################------
   ------#################------
    -----###############-------
      #--###########---------
        #------------------
            -----------
|
The following broadband stations were used for the source inversion: C04A CIA DBIC FRNY FVM HEBO HWUT I03A I05A JTS LBTB LSZ M05C MLAC MNTX N02C NATX P05C P08A PLAL RCBR TEIG W14A
|
Location of the earthquake (yellow star) and great circle path from the epicenter to each station (red) [created using GMT (Wessel, P., and W. H. F. Smith, New version of Generic Mapping Tools released, EOS Trans. AGU, 76 329, 1995.)] |
All observed and Greens function waveforms are corrected to instrument response to ground velocity in meters/sec for the passband of 0.01 - 5 Hz. Next tre traces were bandpass filtered by the application of the following high- and low-pass stages:
hp c 0.0167 2
lp c 0.0833 2
br c 0.12 0.25 n 4 p 2
The traces were next integrated to ground displacment in meters. Finally waveforms were cut from 30 seconds before to 140 seconds after the P arrival so that the direct P wave, pP and perhaps the sP are included.
The source inversion is a multipass operation since a lower frequency filter band is used for larger earthquakes and since a search is made over depth. Up to three passed of the outer loop are made, after which the moment magnitude is determined and filter settings readjusted. The inner loop over depth samples all depths from 0 to 800 km with 5 km increments in depth to 50 km, followed by 10 km depth sampling for the remaining range.
The following filter ranges are used according to the moment magnitude Mw:
   FILTER_BAND   FH(s)  FL(s)
       1           60     12      Mw < 6.4
       2          100     20      6.4 < Mw <= 6.9
       3          120     40      Mw > 6.9
For this data set the favored solution is
WVFMTD96 35.0 250. 74. 155. 5.88 0.125 0.263E-06 0.337 0.353 0.881E-07 82.4
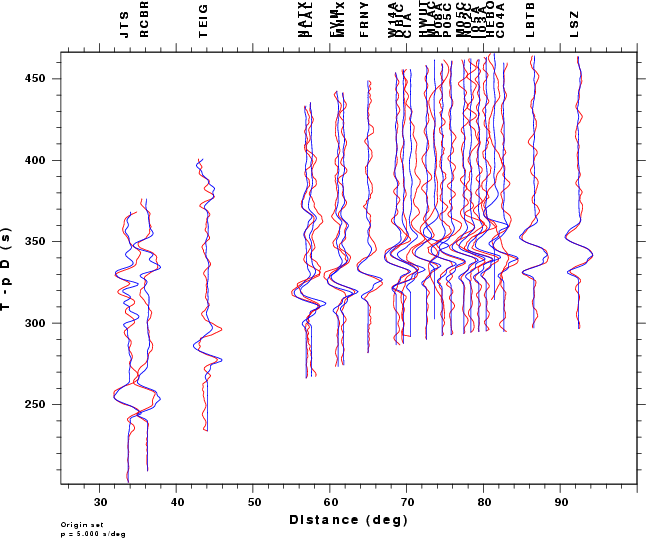
The following figures show the sensitivity of the goodness of fit parameter so source depth, the waveform comparison as a function of epicentral distance in degrees and the source to station azimuth
|
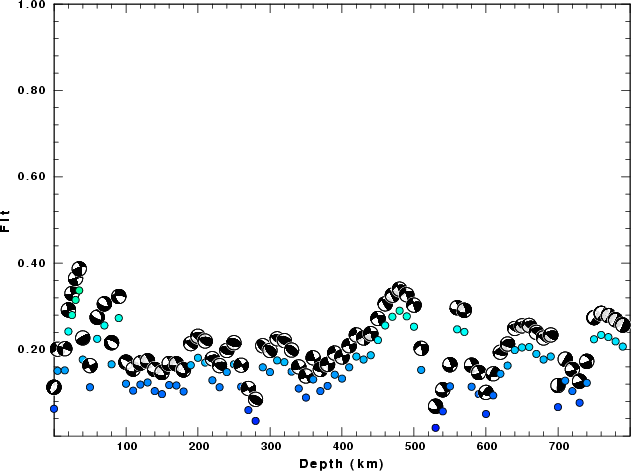
| Goodness of fit as a function of source depth. The measure is 1 - SUM (o -p)2 / SUM o2. A value of 1.0 is the best fit. The best double couple mechanism for the solution depth is plotted above goodness of fit value to indicate how the mefhanism may change with depth. |
|
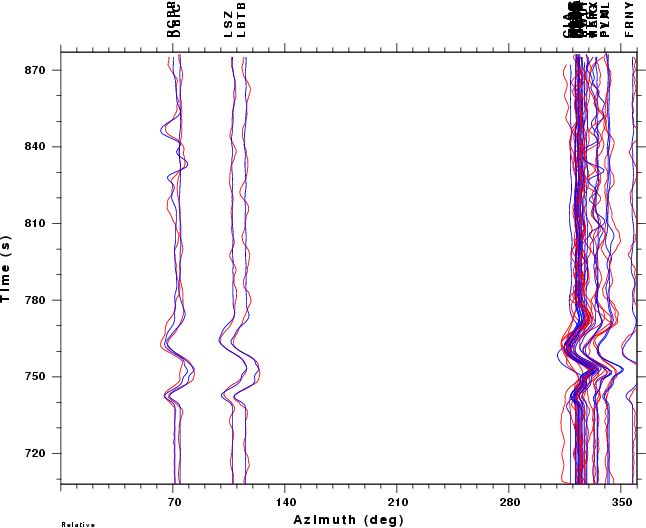
|
| Comparison of the observed traces (red) and solution predicted traces (blue) as a function of source to station azimuth in degrees (D). The purpose of this display is to highlight the azimuthal dependence on the first motion. The traces are annotated with the station name at the top. |