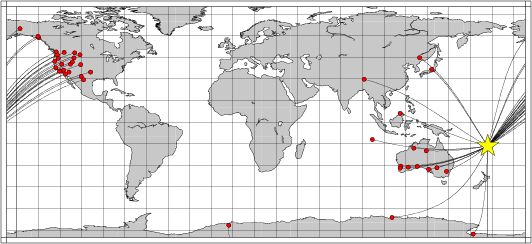
Location of the earthquake (yellow star) and great circle path from the epicenter to each station (red) [created using GMT (Wessel, P., and W. H. F. Smith, New version of Generic Mapping Tools released, EOS Trans. AGU, 76 329, 1995.)]
2006/04/07 08:30:43 -16.62 177.00 7
The following compares this source inversion to the USGS Rapid Moment Tensor Solution and to the Harvard CMT solutions, if they are available.
Mw=6.3

2006/04/07 08:30:43    EVID:
LAT: 16.62S, LON: 177.00E, DEPTH:  15
Mw: 6.3, mb: 0.0, Ms: 0.0
Mo=  0.348E+26 (dyne-cm)

No. of Stations:  42, GAP: 121
Error (clvd/dc)*100=  12.24
Bandpass:  12 -  60 sec
Nodal plane parameters
      strike     dip    rake
NP1:     274      80     -13
NP2:       6      77    -170

             ##########-----
          #############--------
        T ##############----------
     ##   ##############------------
    ####################-------------
   #####################--------------
  ######################---------------
 #######################----------------
 #######################----------------
 ##---------------------##--------------
 -----------------------############----
 -----------------------################
 ----------------------#################
 ----------------------#################
  ---------------------################
   ---   -------------################
    -- P -------------###############
     -   ------------###############
       --------------#############
          ----------###########
             ------#########


Stat Dist Az Misfit   Stat Dist Az Misfit
A04A  84  35  1.01    BAK   79  48  0.96
BBOO  40 238  0.55    BESE  84  23  1.09
BLDU  56 244  0.69    CASY  65 204  1.03
COCO  77 260  1.08    COLA  85  14  1.04
DUG   86  46  1.06    E05A  83  37  1.09
EGMT  91  40  1.07    FARB  78  44  0.92
FITZ  48 260  0.98    FORT  46 243 32.11
HWUT  87  45  1.08    I05A  82  39  0.98
ISCO  91  48  1.04    KKM   64 285  0.79
KMBL  51 243  1.50    L02A  80  40  0.95
LAO   93  42  0.94    LKWY  89  43  0.95
LSA   94 299  0.67    LTX   89  59  0.97
MAJO  64 325  0.69    MDJ   74 326  0.67
MNTX  88  56  1.02    MPM   81  48  1.02
MUN   56 242  0.99    NEW   87  37  1.18
O07A  82  44  0.93    PHL   78  47  1.10
QSPA  73 180  1.46    SBA   61 182  1.54
SKAG  85  22  1.07    SNAA  91 180  1.32
STKA  35 238  0.59    WMOK  94  55  1.02
WRAB  40 258  0.91    X13A  83  50  0.96
YAQ   80  51  0.95    YNG   31 230  0.72
 Misfit > 1 heavily downweighted
|
Mw=6.3 FIJI

2006/04/07 08:30:43.26    EVID: LFAL
LAT: 16.62S, LON: 177.00E, DEPTH:  10
Mw: 6.3, mb: 6.3, Ms: 6.3
Mo=  0.373E+26 (dyne-cm)

No. of Stations:  11, GAP: 272
Error (clvd/dc)*100=  13.92

Nodal plane parameters
      strike     dip    rake
NP1:      84      84      12
NP2:     353      78     174

                ###-------
           #########-----------
        ############--------------
      ###############---------------
     #################---------------
    ##################----------------
   ###################-----------------
  #####################-----------------
  #####################-----------------
 #######################-----------------
 #######################-------------####
 #######################--###############
 -----------------------#################
  ----------------------################
  ----------------------################
   ---------------------###############
    ---------------------#############
     -------------------#############
      ------------------############
        ----------------##########
           -------------#######
                --------##

Stat Dist Az Misfit   Stat Dist Az Misfit
BW06  89  44  0.80    CMB   79  45  0.76
HLID  86  42  0.83    ISCO  91  48  0.82
MA2   78 346  0.67    MAJO  64 325  0.72
MOD   82  42  0.86    NEW   87  37  0.81
TPNV  82  47  0.81    TUC   84  54  0.83
WDC   79  42  0.79

Median of misfit:  0.81
  Average misfit:  0.79
|
April 7, 2006, FIJI, MW=6.4

Natasha Maternovskaya

CENTROID, MOMENT TENSOR SOLUTION
HARVARD EVENT-FILE NAME C040706A
DATA USED: GSN
L.P. BODY WAVES: 79S,188C, T= 40
MANTLE WAVES:    77S,159C, T=125
CENTROID LOCATION:
ORIGIN TIME       08:30:50.9 0.1
LAT 16.51S 0.01;LON 177.08E 0.01
DEP  12.0 FIX;HALF-DURATION  4.1
MOMENT TENSOR; SCALE 10**25 D-CM
  MRR= 0.07 0.03; MTT=-0.25 0.04
  MPP= 0.18 0.05; MRT= 0.34 0.10
  MRP= 0.25 0.12; MTP= 5.77 0.03
 PRINCIPAL AXES:
 1.(T) VAL=  5.77;PLG= 4;AZM=314
 2.(N)       0.04;    86;    124
 3.(P)      -5.81;     1;    224
BEST DOUBLE COUPLE:M0=5.8*10**25
 NP1:STRIKE=359;DIP=87;SLIP= 178
 NP2:STRIKE= 89;DIP=88;SLIP=   3

            #####------
        #########----------
      T ##########-----------
    #   ##########-------------
   ###############--------------
  ################---------------
  ################---------------
 #################----------------
 #################----------------
 -----------------################
 -----------------################
  ----------------###############
  ----------------###############
   ---------------##############
    -   ----------#############
      P ----------###########
        ----------#########
            ------#####
|
The following broadband stations were used for the source inversion: A04A BAK BBOO BESE BLDU CASY COCO COLA DUG E05A EGMT FARB FITZ FORT HWUT I05A ISCO KKM KMBL L02A LAO LKWY LSA LTX MAJO MDJ MNTX MPM MUN NEW O07A PHL QSPA SBA SKAG SNAA STKA WMOK WRAB X13A YAQ YNG
|
Location of the earthquake (yellow star) and great circle path from the epicenter to each station (red) [created using GMT (Wessel, P., and W. H. F. Smith, New version of Generic Mapping Tools released, EOS Trans. AGU, 76 329, 1995.)] |
All observed and Greens function waveforms are corrected to instrument response to ground velocity in meters/sec for the passband of 0.01 - 5 Hz. Next tre traces were bandpass filtered by the application of the following high- and low-pass stages:
hp c 0.0167 2
lp c 0.0833 2
The traces were next integrated to ground displacment in meters. Finally waveforms were cut from 30 seconds before to 140 seconds after the P arrival so that the direct P wave, pP and perhaps the sP are included.
The source inversion is a multipass operation since a lower frequency filter band is used for larger earthquakes and since a search is made over depth. Up to three passed of the outer loop are made, after which the moment magnitude is determined and filter settings readjusted. The inner loop over depth samples all depths from 0 to 800 km with 5 km increments in depth to 50 km, followed by 10 km depth sampling for the remaining range.
The following filter ranges are used according to the moment magnitude Mw:
   FILTER_BAND   FH(s)  FL(s)
       1           60     12      Mw < 6.4
       2          100     20      6.4 < Mw <= 6.9
       3          120     40      Mw > 6.9
For this data set the favored solution is
WVFMTD96 15.0 274. 80. -13. 6.33 0.016 0.438E-05 0.251 0.128 0.578E-06 12.2
The following figures show the sensitivity of the goodness of fit parameter so source depth, the waveform comparison as a function of epicentral distance in degrees and the source to station azimuth
|
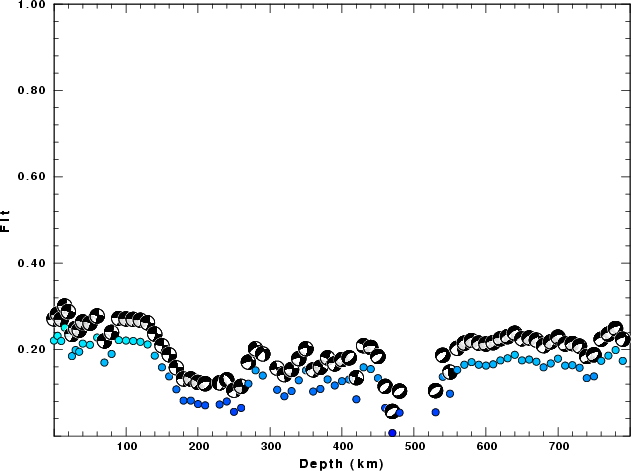
| Goodness of fit as a function of source depth. The measure is 1 - SUM (o -p)2 / SUM o2. A value of 1.0 is the best fit. The best double couple mechanism for the solution depth is plotted above goodness of fit value to indicate how the mefhanism may change with depth. |
|
|
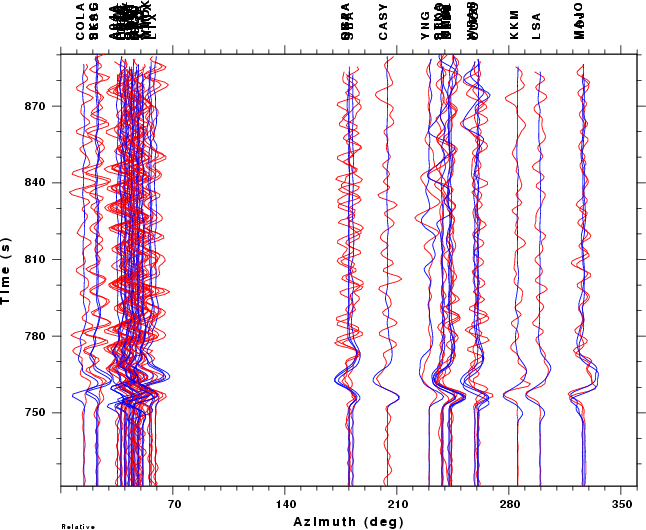
| Comparison of the observed traces (red) and solution predicted traces (blue) as a function of source to station azimuth in degrees (D). The purpose of this display is to highlight the azimuthal dependence on the first motion. The traces are annotated with the station name at the top. |