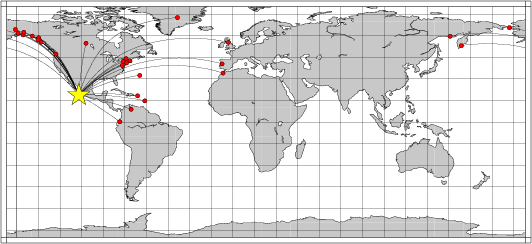
Location of the earthquake (yellow star) and great circle path from the epicenter to each station (red) [created using GMT (Wessel, P., and W. H. F. Smith, New version of Generic Mapping Tools released, EOS Trans. AGU, 76 329, 1995.)]
2006/04/04 02:30:29 18.70 -107.05 44
The following compares this source inversion to the USGS Rapid Moment Tensor Solution and to the Harvard CMT solutions, if they are available.
Mw=5.8

2006/04/04 02:30:29    EVID:
LAT: 18.70N, LON: 107.05W, DEPTH:  60
Mw: 5.8, mb: 0.0, Ms: 0.0
Mo=  0.561E+25 (dyne-cm)

No. of Stations:  27, GAP: 202
Error (clvd/dc)*100=  19.52
Bandpass:  12 -  60 sec
Nodal plane parameters
      strike     dip    rake
NP1:     336      46     -79
NP2:     140      45    -101

                ##########
           ------##############
        -------------#############
      ##----------------############
     ##-------------------###########
    ###--------------------###########
   ####----------------------##########
  #####-----------------------##########
  #####------------------------#########
 #######-----------------------##########
 #######------------------------#########
 ########-----------------------#########
 #########-----------------------########
  #########----------------------#######
  ##########---------------------#######
   ###########-------------------######
    ############-----------------#####
     #############--------------#####
      ###############-----------####
        ###################----##-
           ###################-
                ##########

Stat Dist Az Misfit   Stat Dist Az Misfit
BBSR  40  61  0.44    BESE  44 339  0.68
BINY  35  41  0.44    BPAW  54 337  0.75
CRAG  41 337  1.32    D04A  31 338  0.78
ESK   82  34  2.23    EYAK  50 336  0.51
FDF   44  87  1.39    FFC   36   4  1.05
HARP  51 338  0.58    HRV   38  43  0.34
MA2   80 329  2.43    MTE   85  49  1.60
NCB   37  40  0.72    OTAV  33 119  0.96
PAL   36  44  0.28    PET   77 321  1.90
PMR   51 335  0.49    PNL   47 338  0.43
RTC   87  54  1.73    SDMD  33  45  0.93
SDV   36 100  0.63    SIT   43 337  0.69
SJG   38  84  0.32    SUMG  65  17  4.65
TNA   61 335  1.13
 Misfit > 1 heavily downweighted
|
FF COAST OF JALISCO, MEXICO

2006/04/04 02:30:29.32    EVID: LCAD
LAT: 18.70N, LON: 107.04W, DEPTH:  30
Mw: 5.9, mb: 6.0, Ms: 6.0
Mo=  0.895E+25 (dyne-cm)

No. of Stations:   5, GAP: 252
Error (clvd/dc)*100=  32.12

Nodal plane parameters
      strike     dip    rake
NP1:      21      89     -16
NP2:     111      74     181

                ----------
           -----------------###
        -------------------#######
      --------------------##########
     ---------------------###########
    ---------------------#############
   ---------------------###############
  #---------------------################
  ###------------------#################
 ######---------------###################
 #########------------###################
 ############--------####################
 ################---#####################
  ##################--##################
  #################---------############
   ###############---------------------
    #############---------------------
     ############--------------------
      ##########--------------------
        #######-------------------
           ###-----------------
                ----------

Stat Dist Az Misfit   Stat Dist Az Misfit
BBSR  40  61  0.51    PAL   36  44  0.95
PMR   51 335  0.85    SIT   43 337  0.67
SJG   38  84  0.59

Median of misfit:  0.67
  Average misfit:  0.71
|
April 4, 2006, OFF COAST OF JALISCO, MEXICO, MW=5.9

Natasha Maternovskaya

CENTROID, MOMENT TENSOR SOLUTION
HARVARD EVENT-FILE NAME C040406A
DATA USED: GSN
L.P. BODY WAVES: 77S,177C, T= 40
SURFACE WAVES:   79S,172C, T= 50
CENTROID LOCATION:
ORIGIN TIME       02:30:28.7 0.1
LAT 18.80N 0.01;LON 107.10W 0.01
DEP  24.2 0.7;HALF-DURATION  2.3
MOMENT TENSOR; SCALE 10**25 D-CM
  MRR=-0.05 0.01; MTT=-0.56 0.01
  MPP= 0.61 0.01; MRT=-0.09 0.03
  MRP= 0.22 0.03; MTP=-0.82 0.01
 PRINCIPAL AXES:
 1.(T) VAL=  1.08;PLG=12;AZM=243
 2.(N)      -0.10;    78;     57
 3.(P)      -0.98;     1;    153
BEST DOUBLE COUPLE:M0=1.0*10**25
 NP1:STRIKE=287;DIP=81;SLIP= 172
 NP2:STRIKE= 18;DIP=82;SLIP=   9

            -----------
        ---------------####
      ----------------#######
    ------------------#########
   ------------------###########
  -------------------############
  ####---------------############
 ##############-----##############
 ##################--#############
 ##################-------########
 #################------------####
  #   ############---------------
  # T ###########----------------
      ##########----------------
    ###########----------------
      ########----------   --
        #####----------- P
            -----------
|
The following broadband stations were used for the source inversion: BBSR BESE BINY BPAW CRAG D04A ESK EYAK FDF FFC HARP HRV MA2 MTE NCB OTAV PAL PET PMR PNL RTC SDMD SDV SIT SJG SUMG TNA
|
Location of the earthquake (yellow star) and great circle path from the epicenter to each station (red) [created using GMT (Wessel, P., and W. H. F. Smith, New version of Generic Mapping Tools released, EOS Trans. AGU, 76 329, 1995.)] |
All observed and Greens function waveforms are corrected to instrument response to ground velocity in meters/sec for the passband of 0.01 - 5 Hz. Next tre traces were bandpass filtered by the application of the following high- and low-pass stages:
hp c 0.0167 2
lp c 0.0833 2
br c 0.12 0.25 n 4 p 2
The traces were next integrated to ground displacment in meters. Finally waveforms were cut from 30 seconds before to 140 seconds after the P arrival so that the direct P wave, pP and perhaps the sP are included.
The source inversion is a multipass operation since a lower frequency filter band is used for larger earthquakes and since a search is made over depth. Up to three passed of the outer loop are made, after which the moment magnitude is determined and filter settings readjusted. The inner loop over depth samples all depths from 0 to 800 km with 5 km increments in depth to 50 km, followed by 10 km depth sampling for the remaining range.
The following filter ranges are used according to the moment magnitude Mw:
   FILTER_BAND   FH(s)  FL(s)
       1           60     12      Mw < 6.4
       2          100     20      6.4 < Mw <= 6.9
       3          120     40      Mw > 6.9
For this data set the favored solution is
WVFMTD96 60.0 336. 46. -79. 5.80 0.345 0.169E-06 0.395 0.634 0.156E-06 19.5
The following figures show the sensitivity of the goodness of fit parameter so source depth, the waveform comparison as a function of epicentral distance in degrees and the source to station azimuth
|
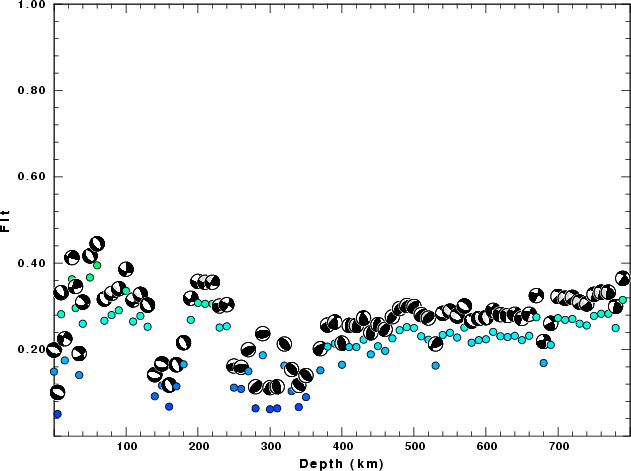
| Goodness of fit as a function of source depth. The measure is 1 - SUM (o -p)2 / SUM o2. A value of 1.0 is the best fit. The best double couple mechanism for the solution depth is plotted above goodness of fit value to indicate how the mefhanism may change with depth. |
|
|
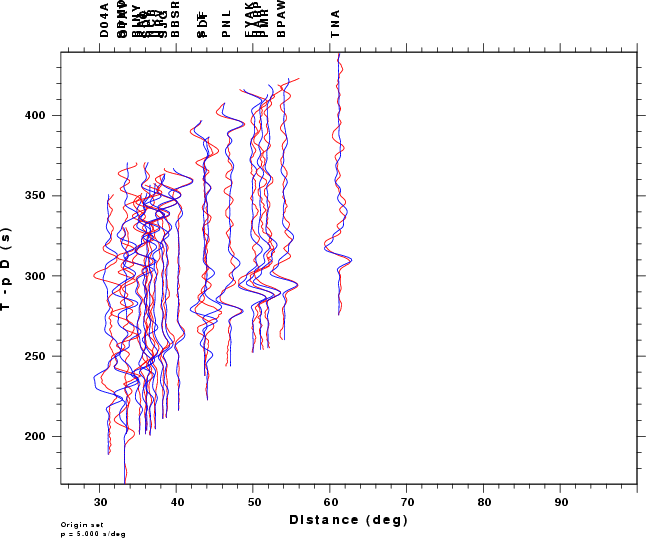
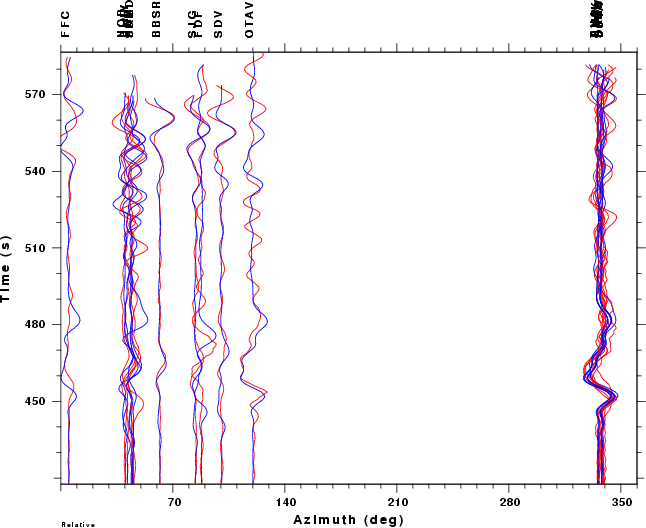
| Comparison of the observed traces (red) and solution predicted traces (blue) as a function of source to station azimuth in degrees (D). The purpose of this display is to highlight the azimuthal dependence on the first motion. The traces are annotated with the station name at the top. |