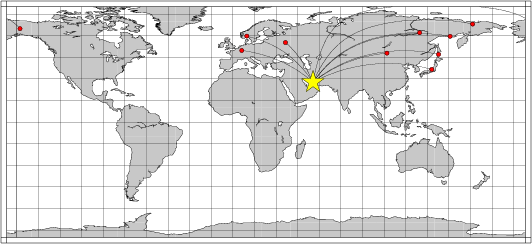
Location of the earthquake (yellow star) and great circle path from the epicenter to each station (red) [created using GMT (Wessel, P., and W. H. F. Smith, New version of Generic Mapping Tools released, EOS Trans. AGU, 76 329, 1995.)]
2006/03/25 07:29:01 27.65 55.66 44
The following compares this source inversion to the USGS Rapid Moment Tensor Solution and to the Harvard CMT solutions, if they are available.
Mw=5.7

2006/03/25 07:29:01    EVID:
LAT: 27.65N, LON:  55.66E DEPTH:  20
Mw: 5.7, mb: 0.0, Ms: 0.0
Mo=  0.408E+25 (dyne-cm)

No. of Stations:  10, GAP: 255
Error (clvd/dc)*100=  55.44

Nodal plane parameters
      strike     dip    rake
NP1:     255      50      85
NP2:      82      40      96

                ----------
           --------------------
        --------------------------
      ------------------------------
     --------------------------------
    -------------------#######--------
   ------------#####################---
  ----------###########################-
  -------###############################
 ------##################################
 ----###################################-
 ---###################################--
 --###################################---
  ###################################---
  --###############################-----
   ---##########################-------
    ------###################---------
     -----------######---------------
      ------------------------------
        --------------------------
           --------------------
                ----------

Stat Dist Az Misfit   Stat Dist Az Misfit
BILL  71  21  0.45    COLA  85   9  0.38
KONO  44 328  0.77    MA2   69  32  0.31
MAJO  68  59  0.43    OBN   30 338  0.55
ULN   44  48  0.41    WLF   43 314  0.34
YAK   58  32  0.31    YSS   68  47  0.53
 Misfit > 1 heavily downweighted
|
Mw=5.9 SOUTHERN IRAN

2006/03/25 07:29: 1.49    EVID: KSAR
LAT: 27.66N, LON:  55.66E, DEPTH:  90
Mw: 5.9, mb: 5.8, Ms: 5.8
Mo=  0.926E+25 (dyne-cm)

No. of Stations:  10, GAP: 255
Error (clvd/dc)*100=  29.82

Nodal plane parameters
      strike     dip    rake
NP1:     205      83      21
NP2:     113      69     173

                ----------
           ------------------##
        --------------------######
      ---------------------#########
     --------------------############
    --------------------##############
   --------------------################
  #-------------------##################
  ###----------------###################
 ######-------------#####################
 ########-----------#####################
 ###########-------######################
 ##############---#######################
  ###############--#####################
  ##############--------################
   #############------------------##---
    ###########-----------------------
     #########-----------------------
      ########----------------------
        #####---------------------
           ##------------------
                ----------

Stat Dist Az Misfit   Stat Dist Az Misfit
BILL  71  21  0.89    COLA  85   9  0.94
KONO  44 328  0.97    MA2   69  32  0.76
MAJO  68  59  0.58    OBN   30 338  1.01
ULN   44  48  1.02    WLF   43 314  1.73
YAK   58  32  0.79    YSS   68  47  0.67

Median of misfit:  0.92
  Average misfit:  0.94
|
March 25, 2006, SOUTHERN IRAN, MW=5.9

Meredith Nettles

CENTROID, MOMENT TENSOR SOLUTION
HARVARD EVENT-FILE NAME C032506A
DATA USED: GSN
L.P. BODY WAVES: 75S,163C, T= 40
SURFACE WAVES:   72S,172C, T= 50
CENTROID LOCATION:
ORIGIN TIME       07:29: 2.1 0.1
LAT 27.43N 0.01;LON  55.62E 0.01
DEP  12.0 FIX;HALF-DURATION  2.1
MOMENT TENSOR; SCALE 10**24 D-CM
  MRR= 5.33 0.06; MTT=-6.59 0.06
  MPP= 1.26 0.07; MRT= 4.61 0.17
  MRP=-0.71 0.17; MTP= 0.45 0.06
 PRINCIPAL AXES:
 1.(T) VAL=  6.95;PLG=71;AZM= 16
 2.(N)       1.26;     4;    276
 3.(P)      -8.21;    19;    184
BEST DOUBLE COUPLE:M0=7.6*10**24
 NP1:STRIKE=268;DIP=26;SLIP=  81
 NP2:STRIKE= 97;DIP=64;SLIP=  94

            -----------
        -------------------
      --------########-------
    -----#################-----
   ---#######################---
  ---############   ###########--
  -############## T ############-
 -###############   #############-
 -################################
 ---##############################
 -------#########################-
  -----------################----
  -------------------------------
   -----------------------------
    ---------------------------
      ---------   -----------
        ------- P ---------
            ---   -----
|
The following broadband stations were used for the source inversion: BILL COLA KONO MA2 MAJO OBN ULN WLF YAK YSS
|
Location of the earthquake (yellow star) and great circle path from the epicenter to each station (red) [created using GMT (Wessel, P., and W. H. F. Smith, New version of Generic Mapping Tools released, EOS Trans. AGU, 76 329, 1995.)] |
The source inversion is a multipass operation since a lower frequency filter band is used for larger earthquakes and since a search is made over depth. Up to three passed of the outer loop are made, after which the moment magnitude is determined and filter settings readjusted. The inner loop over depth samples all depths from 0 to 800 km with 5 km increments in depth to 50 km, followed by 10 km depth sampling for the remaining range.
The following filter ranges are used according to the moment magnitude Mw:
   FILTER_BAND   FH(s)  FL(s)
       1           60     12      Mw < 6.4
       2          100     20      6.4 < Mw <= 6.9
       3          120     40      Mw > 6.9
For this data set the favored solution is
WVFMTD96 20.0 255. 50. 85. 5.74 0.491 0.137E-06 0.491 0.738 0.137E-06 55.4
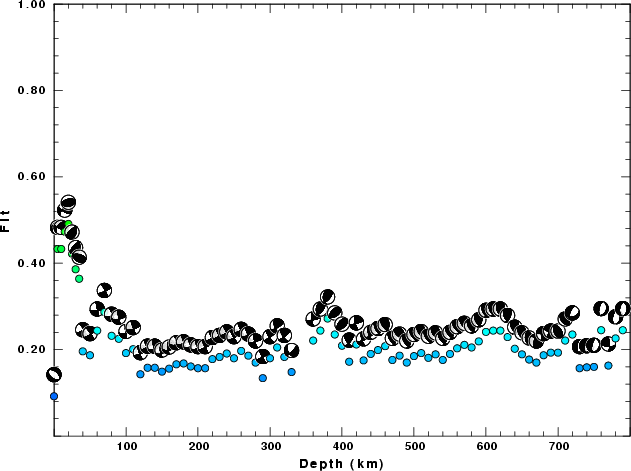
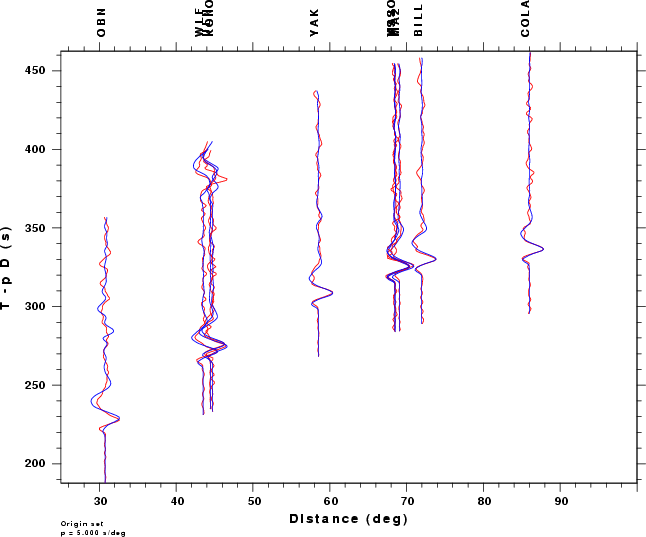
The following figures show the sensitivity of the goodness of fit parameter so source depth, the waveform comparison as a function of epicentral distance in degrees and the source to station azimuth
|
| Goodness of fit as a function of source depth. The measure is 1 - SUM (o -p)2 / SUM o2. A value of 1.0 is the best fit. The best double couple mechanism for the solution depth is plotted above goodness of fit value to indicate how the mefhanism may change with depth. |
|
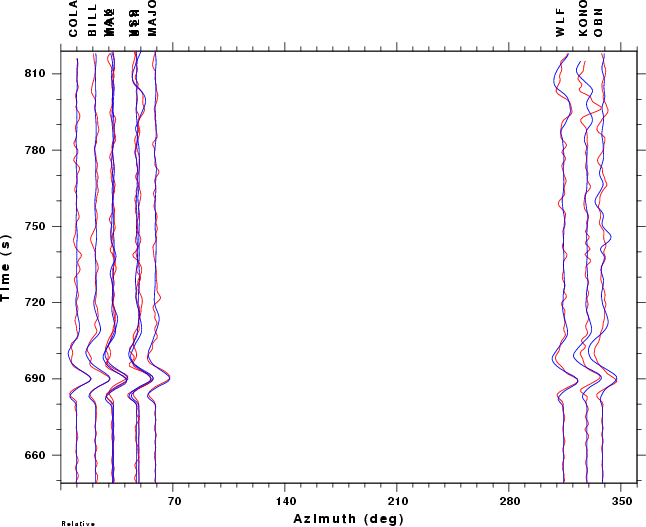
|
| Comparison of the observed traces (red) and solution predicted traces (blue) as a function of source to station azimuth in degrees (D). The purpose of this display is to highlight the azimuthal dependence on the first motion. The traces are annotated with the station name at the top. |