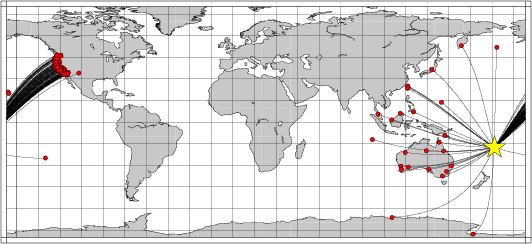
Location of the earthquake (yellow star) and great circle path from the epicenter to each station (red) [created using GMT (Wessel, P., and W. H. F. Smith, New version of Generic Mapping Tools released, EOS Trans. AGU, 76 329, 1995.)]
2006/02/02 12:48:43 -17.67 -178.37 595
The following compares this source inversion to the USGS Rapid Moment Tensor Solution and to the Harvard CMT solutions, if they are available.
Mw=6.8

2006/02/02 12:48:43    EVID:
LAT: 17.67S, LON: 178.37W, DEPTH: 610
Mw: 6.8, mb: 0.0, Ms: 0.0
Mo=  0.150E+27 (dyne-cm)

No. of Stations: 146, GAP:  76
Error (clvd/dc)*100=  35.07

Nodal plane parameters
      strike     dip    rake
NP1:      13      64    -126
NP2:     253      43     -39

                ##########
           ################----
        ###################-------
      ######################--------
     #######################---------
    ############------------######----
   #########----------------#########--
  #######-------------------############
  #####---------------------############
 #####----------------------#############
 ###------------------------#############
 ##------------------------##############
 ##------------------------##############
  ------------------------##############
  ------------------------##############
   ----------------------##############
    --------------------##############
     ------------------##############
      ----------------##############
        -------------#############
           --------############
                -#########

Stat Dist Az Misfit   Stat Dist Az Misfit
109C  77  49  0.36    ADK   69   1  0.42
ARMA  30 239 36.24    BAK   77  46  0.30
BAR   77  49  0.27    BBOO  43 240  0.47
BBR   77  48  0.29    BC3   78  49  0.33
BDM   76  42  0.34    BEL   78  48  0.39
BFS   77  47  0.34    BLDU  59 244  0.29
BVDA  77  49  0.80    BZN   77  48  0.40
CASY  66 204  0.18    CHF   77  47  0.31
CIA   76  48  0.27    CMB   77  43  0.34
COCO  81 259  0.18    COEN  37 270  1.71
CRY   77  48  0.38    CTAO  33 260  0.24
CVS   76  42  0.35    CWC   78  45  0.34
DAN   79  48  0.38    DAV   60 289  1.25
DBO   78  37  0.47    DEC   76  47  0.27
DGR   77  48  0.33    DJJ   76  47  0.37
DVT   77  49  0.91    EUO   79  37  0.94
FARB  75  42  0.66    FMP   76  47  0.31
FRD   77  48  0.31    FUR   79  46  0.41
G04A  80  36  0.37    G05A  81  36  0.37
GASB  77  40  0.34    GLA   78  50  0.26
GRA   79  45  0.32    GSC   78  47  0.40
GUMO  47 308  0.47    H03A  79  36  0.37
H04A  80  36  0.36    HAST  75  44  0.27
HATC  78  40  0.45    HEC   78  47  0.43
HELL  77  45  0.38    HOPS  76  41  0.28
HUMO  78  38  0.31    HWB   77  49  0.93
I02A  79  36  0.39    I03A  79  37  0.34
I05A  80  37  0.36    IRM   79  48  0.31
ISA   77  46  0.30    JCS   77  49  0.35
JRO   81  35  0.97    JRSC  76  42  0.66
KCC   77  44  0.32    KKM   68 283  0.26
KMBL  55 243  1.63    KNW   77  48  0.31
KSM   72 277  0.21    KUM   83 277  0.20
LAVA  77  42  0.36    LGU   76  47  0.43
LRL   78  46  0.28    LTH   82  36  0.34
LVA2  77  49  0.31    M02C  78  39  0.45
M03C  78  39  0.33    M04C  78  39  0.43
M05C  79  40  0.41    M06C  79  40  0.30
MAJO  67 323  0.38    MAUI  43  30  0.52
MBWA  58 255  0.22    MLAC  78  44  0.97
MNRC  76  41  0.34    MOD   79  40  0.34
MONP  77  49  0.33    MPP   76  46  0.35
MUR   77  48  0.41    MWC   77  47  0.26
NACB  71 303  0.36    NWAO  59 241  0.21
O01C  76  39  0.28    O03C  77  40  0.38
O04C  78  41  0.33    O05C  78  41  0.31
ORV   77  41  0.37    OSI   76  46  0.24
P01C  76  40  0.26    P05C  78  42  0.32
PACP  76  43  0.25    PAS   77  47  0.28
PDM   79  49  0.35    PET   73 345  0.49
PFO   77  48  0.32    PHL   76  45  0.25
PIN   80  38  0.88    PKD   76  44  0.25
PLM   77  48  0.32    PMG   34 279  0.41
POHA  43  32  0.45    PPUH  82  37  0.99
PTCN  45 107  0.27    Q03C  76  42  0.28
Q04C  77  42  0.34    R04C  77  42  0.35
R07C  78  43  0.37    RCT   77  45  0.34
RDM   77  48  0.35    RPV   76  47  0.30
S04C  76  43  0.28    S05C  77  43  0.31
S06C  77  43  0.37    SBA   60 183  0.29
SMER  77  48  0.36    SND   77  48  0.30
SOL   77  49  0.26    STD   81  35  0.93
SUTB  77  41  0.30    T05C  76  44  0.31
T06C  77  44  0.39    TATO  72 304  0.43
TOO   37 230 10.15    TRO   77  48  0.34
U04C  76  44  0.27    U05C  76  44  0.30
V03C  75  44  0.31    V04C  75  45  0.32
V05C  76  45  0.33    WDC   77  40  0.41
WENL  76  42  0.49    WIFE  80  37  1.02
WMC   77  48  0.55    WRAB  44 259  0.34
Y12C  79  49  0.29    Y22C  85  52  0.37
YBH   78  39  0.32    YHNB  72 303  0.45
YNG   33 234  0.29    YULB  71 302  0.26
 Misfit > 1 heavily downweighted
|
Mw=6.6 FIJI REGION

2006/02/02 12:48:43.69    EVID: IRAM
LAT: 17.67S, LON: 178.37W, DEPTH: 600
Mw: 6.6, mb: 6.6, Ms: 6.6
Mo=  0.103E+27 (dyne-cm)

No. of Stations:  25, GAP:  95
Error (clvd/dc)*100=   8.37

Nodal plane parameters
      strike     dip    rake
NP1:      18      63     238
NP2:     252      41     -44

                ##########
           #################---
        ####################------
      #######################-------
     ###############---------#-------
    ###########--------------######---
   ########------------------#########-
  #######--------------------###########
  #####----------------------###########
 #####-----------------------############
 ###------------------------#############
 ##-------------------------#############
 ##------------------------##############
  ------------------------##############
  ------------------------##############
   ----------------------##############
    --------------------##############
     ------------------##############
      ---------------###############
        ------------##############
           -------#############
                ##########

Stat Dist Az Misfit   Stat Dist Az Misfit
ADK   69   1  0.26    ANMO  85  51  0.46
BW06  87  43  0.52    CMB   77  43  0.39
COCO  81 259  0.25    COLA  85  12  0.37
COR   79  36  0.30    CTAO  33 260  0.33
GUMO  47 308  0.43    HKT   92  59  0.49
INCN  75 317  0.26    KWAJ  29 331  0.86
MA2   80 344  0.14    MAJO  67 323  0.25
MOD   79  40  0.31    MSO   86  38  0.60
NWAO  59 241  0.14    PAYG  87  90  0.74
PET   73 345  0.38    TUC   81  52  0.42
ULN   92 319  0.25    VNDA  60 184  0.54
WDC   77  40  0.48    YAK   89 338  0.24
YSS   73 333  0.33

Median of misfit:  0.37
  Average misfit:  0.39
|
February 2, 2006, FIJI REGION, MW=6.7

Natasha Maternovskaya

CENTROID, MOMENT TENSOR SOLUTION
HARVARD EVENT-FILE NAME C020206A
DATA USED: GSN
L.P. BODY WAVES: 37S, 95C, T= 50
MANTLE WAVES:    31S, 71C, T=125
CENTROID LOCATION:
ORIGIN TIME       12:48:48.5 0.1
LAT 17.76S 0.01;LON 178.19W 0.01
DEP 609.1 1.1;HALF-DURATION  5.5
MOMENT TENSOR; SCALE 10**26 D-CM
  MRR=-0.88 0.01; MTT= 0.10 0.02
  MPP= 0.78 0.02; MRT= 0.14 0.02
  MRP=-0.90 0.02; MTP= 0.78 0.02
 PRINCIPAL AXES:
 1.(T) VAL=  1.50;PLG=17;AZM=118
 2.(N)      -0.08;    27;     18
 3.(P)      -1.42;    57;    236
BEST DOUBLE COUPLE:M0=1.5*10**26
 NP1:STRIKE=242;DIP=37;SLIP= -40
 NP2:STRIKE=  6;DIP=67;SLIP=-120

            ########---
        #############------
      ###############--------
    ##########--------######---
   ########-----------#########-
  #######-------------###########
  #####---------------###########
 ####-----------------############
 ###------------------############
 ###------------------############
 ##--------   --------############
  #-------- P -------#######   ##
  #--------   -------####### T ##
   -----------------########   #
    ----------------###########
      -------------##########
        ----------#########
            -----######
|
The following broadband stations were used for the source inversion: 109C ADK ARMA BAK BAR BBOO BBR BC3 BDM BEL BFS BLDU BVDA2 BZN CASY CHF CIA CMB COCO COEN CRY CTAO CVS CWC DAN DAV DBO DEC DGR DJJ DVT EUO FARB FMP FRD FUR G04A G05A GASB GLA GRA GSC GUMO H03A H04A HAST HATC HEC HELL HOPS HUMO HWB I02A I03A I05A IRM ISA JCS JRO JRSC KCC KKM KMBL KNW KSM KUM LAVA LGU LRL LTH LVA2 M02C M03C M04C M05C M06C MAJO MAUI MBWA MLAC MNRC MOD MONP MPP MUR MWC NACB NWAO O01C O03C O04C O05C ORV OSI P01C P05C PACP PAS PDM PET PFO PHL PIN PKD PLM PMG POHA PPUHS PTCN Q03C Q04C R04C R07C RCT RDM RPV S04C S05C S06C SBA SMER SND SOL STD SUTB T05C T06C TATO TOO TRO U04C U05C V03C V04C V05C WDC WENL WIFE WMC WRAB Y12C Y22C YBH YHNB YNG YULB
|
Location of the earthquake (yellow star) and great circle path from the epicenter to each station (red) [created using GMT (Wessel, P., and W. H. F. Smith, New version of Generic Mapping Tools released, EOS Trans. AGU, 76 329, 1995.)] |
The source inversion is a multipass operation since a lower frequency filter band is used for larger earthquakes and since a search is made over depth. Up to three passed of the outer loop are made, after which the moment magnitude is determined and filter settings readjusted. The inner loop over depth samples all depths from 0 to 800 km with 5 km increments in depth to 50 km, followed by 10 km depth sampling for the remaining range.
The following filter ranges are used according to the moment magnitude Mw:
   FILTER_BAND   FH(s)  FL(s)
       1           60     12      Mw < 6.4
       2          100     20      6.4 < Mw <= 6.9
       3          120     40      Mw > 6.9
For this data set the favored solution is
WVFMTD96 610.0 13. 64. -126. 6.77 0.176 0.162E-05 0.498 0.442 0.760E-06 35.1
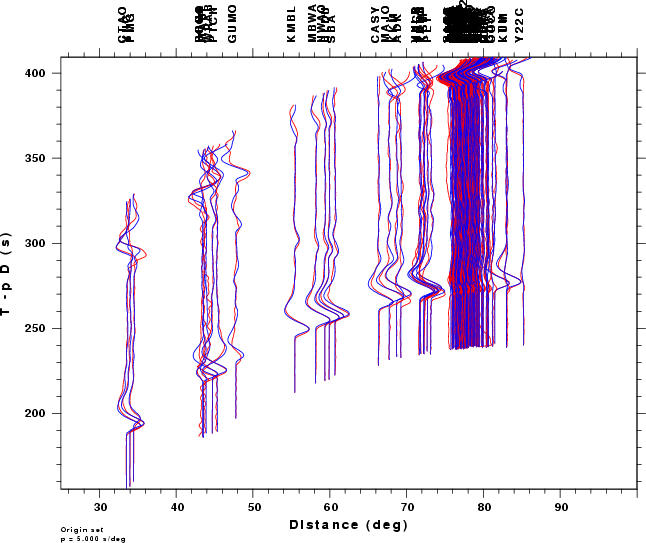
The following figures show the sensitivity of the goodness of fit parameter so source depth, the waveform comparison as a function of epicentral distance in degrees and the source to station azimuth
|
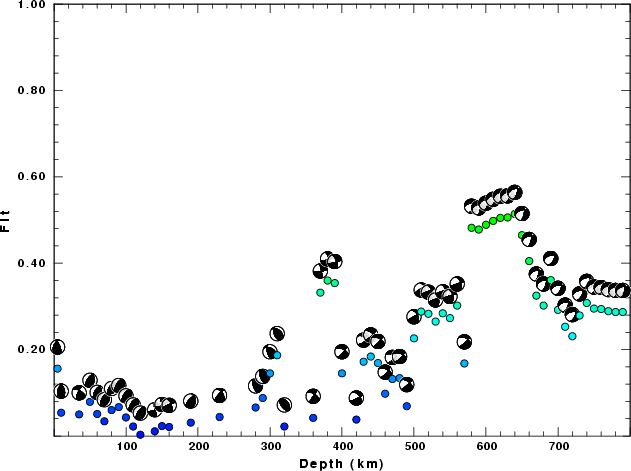
| Goodness of fit as a function of source depth. The measure is 1 - SUM (o -p)2 / SUM o2. A value of 1.0 is the best fit. The best double couple mechanism for the solution depth is plotted above goodness of fit value to indicate how the mefhanism may change with depth. |
|
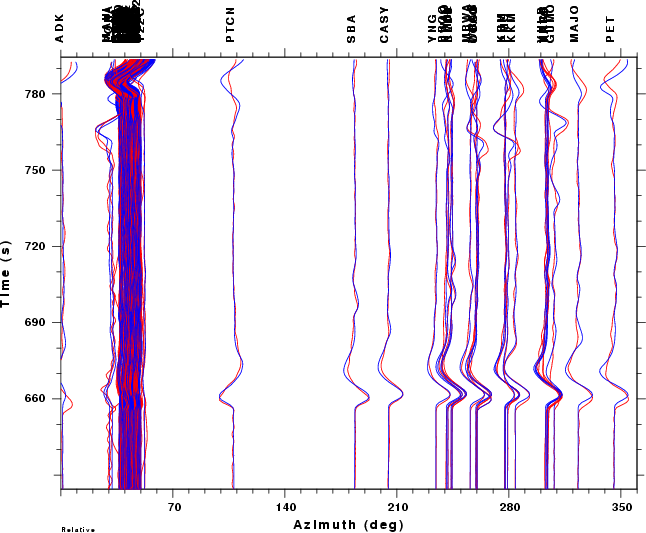
|
| Comparison of the observed traces (red) and solution predicted traces (blue) as a function of source to station azimuth in degrees (D). The purpose of this display is to highlight the azimuthal dependence on the first motion. The traces are annotated with the station name at the top. |