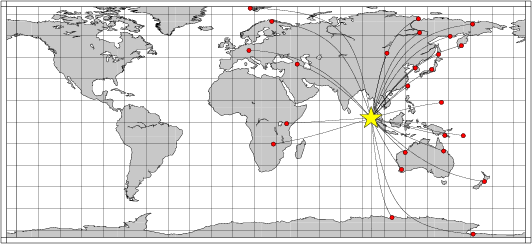
Location of the earthquake (yellow star) and great circle path from the epicenter to each station (red) [created using GMT (Wessel, P., and W. H. F. Smith, New version of Generic Mapping Tools released, EOS Trans. AGU, 76 329, 1995.)]
2006/01/31 19:15:50 2.74 96.06 10
The following compares this source inversion to the USGS Rapid Moment Tensor Solution and to the Harvard CMT solutions, if they are available.
Mw=6.0

2006/01/31 19:15:50    EVID:
LAT:  2.74N, LON:  96.06E, DEPTH:  25
Mw: 6.0, mb: 0.0, Ms: 0.0
Mo=  0.111E+26 (dyne-cm)

No. of Stations:  26, GAP:  73
Error (clvd/dc)*100=  17.05
Bandpass:  12 -  60 sec
Nodal plane parameters
      strike     dip    rake
NP1:     326      80    -100
NP2:     192      14     -45

             ----###########
          ---##################
       ###--######################
     ###------######################
    ###--------######################
   ###-----------#####################
  ###-------------#############   #####
 ###----------------########### T ######
 ###-----------------##########   ######
 ##-------------------##################
 ##--------------------#################
 ##----------------------###############
 ##----------   ----------##############
 ###--------- P -----------#############
  ##---------   ------------###########
   ##------------------------#########
    ##------------------------#######
     ##-----------------------######
       ##----------------------###
          #--------------------
             #--------------


Stat Dist Az Misfit   Stat Dist Az Misfit
BILL  80  21  0.44    CASY  69 173  0.56
CTAO  54 117  0.41    GNI   59 315  0.71
GRFO  84 319  0.78    GUMO  49  74  0.58
HNR   64 101  0.69    INCN  44  35  0.41
KBS   86 348  0.63    KEV   80 340  0.67
KMBO  58 267  3.59    LSZ   69 252  1.78
MA2   70  26  0.43    MAJO  51  43  0.51
MBWA  33 136  0.73    NWAO  40 152  4.21
PET   71  34  0.57    PMG   52 104  0.43
QSPA  92 179  0.75    SBA   88 168  0.90
SNZO  83 131  0.78    TATO  33  45  0.72
TIXI  71  10  0.53    ULN   45  10  0.47
YAK   64  16  0.50    YSS   59  35  0.35
 Misfit > 1 heavily downweighted
|
06/01/31 19:15:50.38
 SIMEULUE, INDONESIA
 Epicenter:   2.744   96.059
 MW 5.9

 USGS MOMENT TENSOR SOLUTION
 Depth  17         No. of sta: 31
 Moment Tensor;   Scale 10**17 Nm
   Mrr= 4.14       Mtt=-3.33
   Mff=-0.82       Mrt= 5.05
   Mrf=-4.06       Mtf= 1.77
  Principal axes:
   T  Val=  7.73  Plg=61  Azm= 45
   N       -0.03       5      305
   P       -7.71      29      212

 Best Double Couple:Mo=7.7*10**17
  NP1:Strike=288 Dip=17 Slip=  72
  NP2:       127     74        96

               -------
          -----------------
        ----###########------
      --###################----
    #########################----
   #---########################---
   -----#############   ########--
  --------########### T #########--
  ----------#########   ##########-
  ------------####################-
  --------------###################
  ----------------#################
   ------------------#############
   --------   -----------#########
    ------- P ---------------####
      -----   -----------------
        ---------------------
          -----------------
               -------
                                      `
|
Harvard CMT


                     -------------
                 ----------------- P --
              --------------------   -----
             ------------------------------
           #---------------------------------
          ##----------------------------------
         ##----###############-----------------
        ############################------------
        ----############################--------
       -----##############################-------
       -----################################-----
       ------#################################---
       -------###############   ###############--
        -------############## T ################
        --------#############   ################
         ---------#############################
          ----------##########################
           ------------######################
             -------------#################
              -------------------####-----
                 ----------------------
                     --------------

Region name: KALIMANTAN, INDONESIA
Date (y/m/d): 2006/1/31

Information on data used in inversion

Wave    nsta  nrec  cutoff
Body      59   111   40
Mantle     0     0   0
Surface   68   138   50

Timing and location information

         hr  min   sec       lat     lon    depth   mb   Ms
PDE      16   40  53.00      1.65   117.98   24.5  5.4  5.4
CMT      16   40  54.50      1.68   117.95   12.0
Error              0.20      0.01     0.02    0.0
Assumed half duration:  1.3


Mechanism informationExponent for moment tensor:  24    units: dyne-cm
         Mrr     Mtt     Mpp     Mrt     Mrp     Mtp
CMT     1.480  -1.180  -0.290  -0.640  -0.160   0.650
Error   0.030   0.020   0.030   0.070   0.080   0.020

Mw = 5.4   Scalar Moment = 1.64e+24
Fault plane:  strike=132    dip=38   slip=114
Fault plane:  strike=283    dip=56   slip=72
Eigenvector:  eigenvalue:  1.68   plunge: 73   azimuth: 147
Eigenvector:  eigenvalue: -0.07   plunge: 14   azimuth: 293
Eigenvector:  eigenvalue: -1.60   plunge:  9   azimuth:  25
|
The following broadband stations were used for the source inversion: BILL CASY CTAO GNI GRFO GUMO HNR INCN KBS KEV KMBO LSZ MA2 MAJO MBWA NWAO PET PMG QSPA SBA SNZO TATO TIXI ULN YAK YSS
|
Location of the earthquake (yellow star) and great circle path from the epicenter to each station (red) [created using GMT (Wessel, P., and W. H. F. Smith, New version of Generic Mapping Tools released, EOS Trans. AGU, 76 329, 1995.)] |
All observed and Greens function waveforms are corrected to instrument response to ground velocity in meters/sec for the passband of 0.01 - 5 Hz. Next tre traces were bandpass filtered by the application of the following high- and low-pass stages:
hp c 0.0167 2
lp c 0.0833 2
The traces were next integrated to ground displacment in meters. Finally waveforms were cut from 30 seconds before to 140 seconds after the P arrival so that the direct P wave, pP and perhaps the sP are included.
The source inversion is a multipass operation since a lower frequency filter band is used for larger earthquakes and since a search is made over depth. Up to three passed of the outer loop are made, after which the moment magnitude is determined and filter settings readjusted. The inner loop over depth samples all depths from 0 to 800 km with 5 km increments in depth to 50 km, followed by 10 km depth sampling for the remaining range.
The following filter ranges are used according to the moment magnitude Mw:
   FILTER_BAND   FH(s)  FL(s)
       1           60     12      Mw < 6.4
       2          100     20      6.4 < Mw <= 6.9
       3          120     40      Mw > 6.9
For this data set the favored solution is
WVFMTD96 25.0 326. 80. -100. 6.00 0.396 0.318E-06 0.441 0.637 0.270E-06 17.0
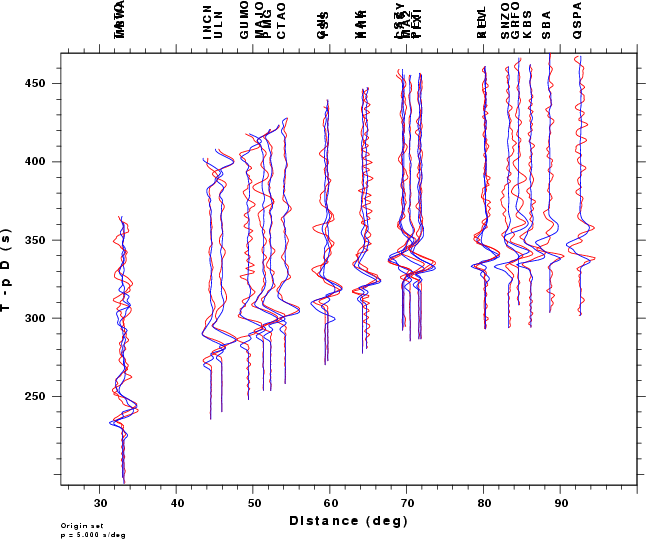
The following figures show the sensitivity of the goodness of fit parameter so source depth, the waveform comparison as a function of epicentral distance in degrees and the source to station azimuth
|
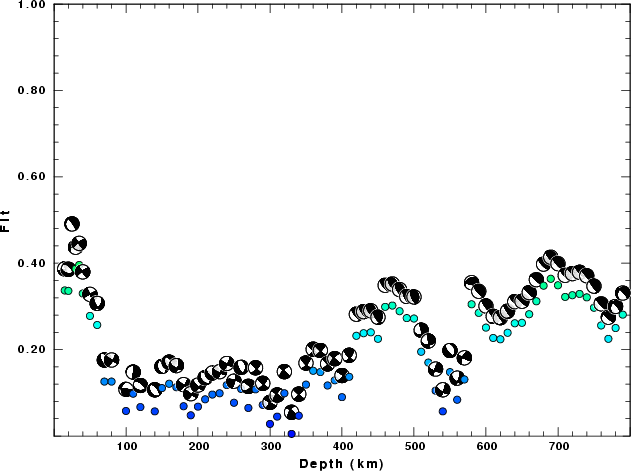
| Goodness of fit as a function of source depth. The measure is 1 - SUM (o -p)2 / SUM o2. A value of 1.0 is the best fit. The best double couple mechanism for the solution depth is plotted above goodness of fit value to indicate how the mefhanism may change with depth. |
|
|
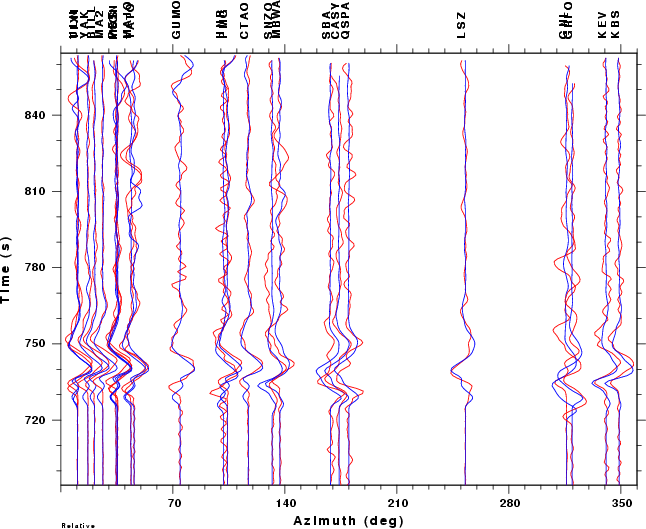
| Comparison of the observed traces (red) and solution predicted traces (blue) as a function of source to station azimuth in degrees (D). The purpose of this display is to highlight the azimuthal dependence on the first motion. The traces are annotated with the station name at the top. |