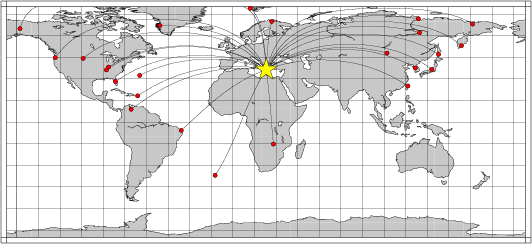
Location of the earthquake (yellow star) and great circle path from the epicenter to each station (red) [created using GMT (Wessel, P., and W. H. F. Smith, New version of Generic Mapping Tools released, EOS Trans. AGU, 76 329, 1995.)]
2006/01/08 11:34:55 36.41 23.21 66
The following compares this source inversion to the USGS Rapid Moment Tensor Solution and to the Harvard CMT solutions, if they are available.
 SLU Moment Tensor Solution
 2006/01/08 11:34:55

 Best Fitting Double Couple
    Mo = 1.26e+26 dyne-cm
    Mw = 6.70
    Z  = 70 km
     Plane   Strike  Dip  Rake
      NP1       55    53   115
      NP2      197    44    61
 Principal Axes:
   Axis    Value   Plunge  Azimuth
     T   1.26e+26     70      24
     N   0.00e+00     20     219
     P  -1.26e+26      5     128


 Moment Tensor: (dyne-cm)
    Component  Value
       Mxx    -3.37e+25
       Mxy     6.61e+25
       Mxz     4.41e+25
       Myy    -7.60e+25
       Myz     8.19e+24
       Mzz     1.10e+26


                     -----------###
                 -----------###########
              -----------#################
             ----------####################
           ----------########################
          ----------#########################-
         ----------##########################--
        ----------###########   ############----
        ---------############ T ############----
       ----------############   ###########------
       ---------##########################-------
       ---------########################---------
       ---------#######################----------
        --------#####################-----------
        --------###################-------------
         -------################---------------
          ------#############-------------   -
           ------#######------------------ P
             #####------------------------
              #####-----------------------
                 ###-------------------
                     --------------


 Harvard Convention
 Moment Tensor:
      R          T          F
  1.10e+26   4.41e+25  -8.19e+24
  4.41e+25  -3.37e+25  -6.61e+25
 -8.19e+24  -6.61e+25  -7.60e+25
|
06/01/08 11:34:52.60
 SOUTHERN GREECE
 Epicenter:  36.250   23.498
 MW 6.7

 USGS MOMENT TENSOR SOLUTION
 Depth  66         No. of sta: 67
 Moment Tensor;   Scale 10**19 Nm
   Mrr= 1.04       Mtt=-0.21
   Mff=-0.83       Mrt= 0.44
   Mrf= 0.02       Mtf=-0.71
  Principal axes:
   T  Val=  1.20  Plg=69  Azm= 18
   N        0.12      20      217
   P       -1.33       6      125

 Best Double Couple:Mo=1.3*10**19
  NP1:Strike=193 Dip=43 Slip=  59
  NP2:        52     54       115

               -------
          ---------########
        --------#############
      --------#################
    ---------###################-
   ---------###################---
   --------#######   ##########---
  --------######## T #########-----
  --------########   ########------
  -------###################-------
  -------#################---------
  -------###############-----------
   ------#############------------
   -------#########-----------   -
    ------######-------------- P
      #####-------------------
        ####-----------------
          ###--------------
               -------
|
The following broadband stations were used for the source inversion: BBSR BILL COLA COR DWPF INCN KBS KEV LSZ MAJO PET RCBR RSSD SDV SFJD SJG TATO TIXI TRIS ULN WCI WVT YAK YSS
|
Location of the earthquake (yellow star) and great circle path from the epicenter to each station (red) [created using GMT (Wessel, P., and W. H. F. Smith, New version of Generic Mapping Tools released, EOS Trans. AGU, 76 329, 1995.)] |
The source inversion is a multipass operation since a lower frequency filter band is used for larger earthquakes and since a search is made over depth. Up to three passed of the outer loop are made, after which the moment magnitude is determined and filter settings readjusted. The inner loop over depth samples all depths from 0 to 800 km with 5 km increments in depth to 50 km, followed by 10 km depth sampling for the remaining range.
The following filter ranges are used according to the moment magnitude Mw:
   FILTER_BAND   FH(s)  FL(s)
       1           60     12      Mw < 6.4
       2          100     20      6.4 < Mw <= 6.9
       3          120     40      Mw > 6.9
For this data set the favored solution is
WVFMTD96 70.0 55. 53. 115. 6.70 0.741 0.105E-05 0.741 0.882 0.105E-05 16.6
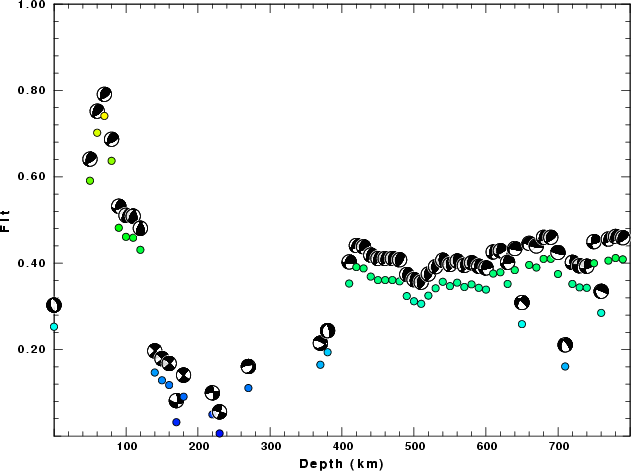
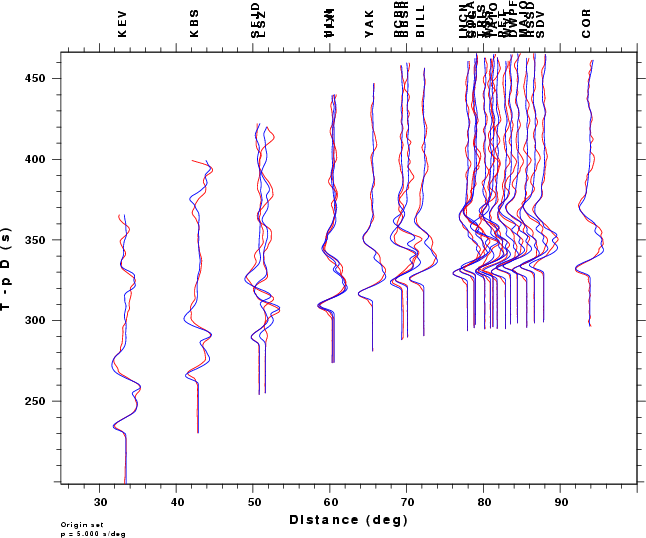
The following figures show the sensitivity of the goodness of fit parameter so source depth, the waveform comparison as a function of epicentral distance in degrees and the source to station azimuth
|
| Goodness of fit as a function of source depth. The measure is 1 - SUM (o -p)2 / SUM o2. A value of 1.0 is the best fit. The best double couple mechanism for the solution depth is plotted above goodness of fit value to indicate how the mefhanism may change with depth. |
|
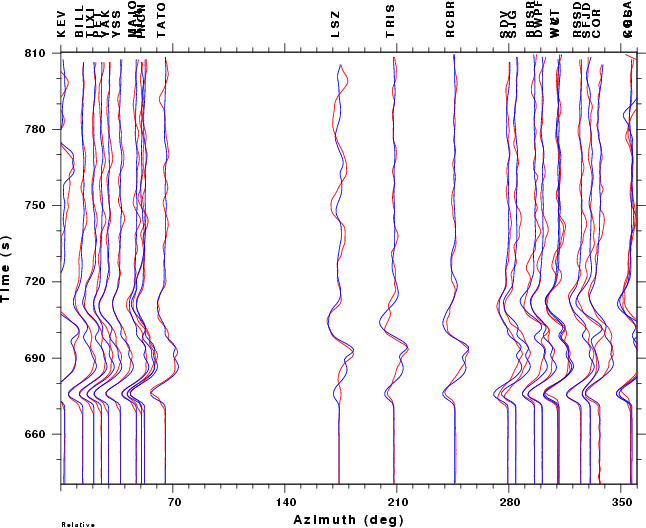
|
| Comparison of the observed traces (red) and solution predicted traces (blue) as a function of source to station azimuth in degrees (D). The purpose of this display is to highlight the azimuthal dependence on the first motion. The traces are annotated with the station name at the top. |