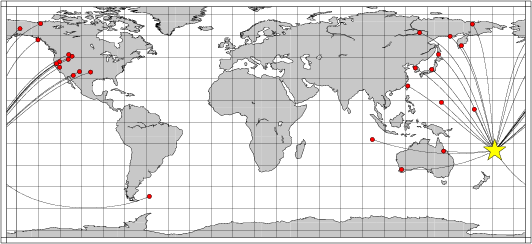
Location of the earthquake (yellow star) and great circle path from the epicenter to each station (red) [created using GMT (Wessel, P., and W. H. F. Smith, New version of Generic Mapping Tools released, EOS Trans. AGU, 76 329, 1995.)]
2006/01/02 22:13:40 -19.88 -178.23 579
The following compares this source inversion to the USGS Rapid Moment Tensor Solution and to the Harvard CMT solutions, if they are available.
Mw=7.3

2006/01/02 22:13:40    EVID:
LAT: 19.88S, LON: 178.23E, DEPTH: 620
Mw: 7.3, mb: 0.0, Ms: 0.0
Mo=  0.850E+27 (dyne-cm)

No. of Stations:  26, GAP:  96
Error (clvd/dc)*100=  49.54

Nodal plane parameters
      strike     dip    rake
NP1:      47      74    -100
NP2:     261      19     -58

                ##########
           ####################
        #######-------------######
      #####---------------------####
     ####----------------------------
    ###---------------------------###-
   ##----------------------------#####-
  ##----------------------------#######-
  #---------------------------##########
 #---------------------------############
 #-------------------------##############
 -------------------------###############
 -----------------------#################
  --------------------##################
  -----------------#####################
   --------------######################
    ----------########################
     ------##########################
      ##############################
        ##########################
           ####################
                ##########

Stat Dist Az Misfit   Stat Dist Az Misfit
ANMO  87  51  0.54    BILL  88 354  0.38
BOZ   88  40  0.56    CMB   79  42  0.47
COCO  81 260  0.18    COLA  87  12  0.31
CTAO  33 263  0.24    EFI   91 147  0.46
GUMO  49 309  0.25    HLID  86  40  0.61
INCN  77 317  0.30    INK   93  15  0.40
KWAJ  31 332  0.48    MA2   83 344  0.47
MAJO  69 323  0.22    MOD   81  39  0.47
MSO   88  38  0.48    NWAO  58 242  0.49
PET   75 345  0.34    SIT   84  21  0.50
TATO  73 304  0.32    TUC   82  52  0.46
WDC   79  39  0.48    WMOK  92  54  0.65
YAK   91 338  0.31    YSS   75 333  0.33
 Misfit > 1 heavily downweighted
|
Mw=7.1 FIJI REGION

2006/01/02 22:13:40.30    EVID: HKAX
LAT: 19.88S, LON: 178.23W, DEPTH: 580
Mw: 7.1, mb: 7.1, Ms: 7.1
Mo=  0.479E+27 (dyne-cm)

No. of Stations:  26, GAP:  96
Error (clvd/dc)*100=  47.18

Nodal plane parameters
      strike     dip    rake
NP1:      61      75     248
NP2:     298      26     -36

                ##########
           ####################
        ########----##############
      ###------------------#########
     #------------------------#######
    ----------------------------######
   -------------------------------###--
  --------------------------------------
  --------------------------------###---
 -------------------------------######---
 ----------------------------#########---
 --------------------------############--
 -----------------------###############--
  ------------------###################-
  --------------#######################-
   --------############################
    ##################################
     ################################
      ##############################
        ##########################
           ####################
                ##########

Stat Dist Az Misfit   Stat Dist Az Misfit
ANMO  87  51  0.57    BILL  88 354  0.16
BOZ   88  40  0.57    CMB   79  42  0.33
COCO  81 260  0.29    COLA  87  12  0.14
CTAO  33 263  0.40    EFI   91 147  0.44
GUMO  49 309  0.37    HLID  86  40  0.69
INCN  77 317  0.21    INK   93  15  0.21
KWAJ  31 332  0.64    MA2   83 344  0.23
MAJO  69 323  0.27    MOD   81  39  0.38
MSO   88  38  0.36    NWAO  58 242  0.17
PET   75 345  0.26    SIT   84  21  0.53
TATO  73 304  0.24    TUC   82  52  0.43
WDC   79  39  0.37    WMOK  92  54  0.63
YAK   91 338  0.18    YSS   75 333  0.25

Median of misfit:  0.35
  Average misfit:  0.36
|
The following broadband stations were used for the source inversion: ANMO BILL BOZ CMB COCO COLA CTAO EFI GUMO HLID INCN INK KWAJ MA2 MAJO MOD MSO NWAO PET SIT TATO TUC WDC WMOK YAK YSS
|
Location of the earthquake (yellow star) and great circle path from the epicenter to each station (red) [created using GMT (Wessel, P., and W. H. F. Smith, New version of Generic Mapping Tools released, EOS Trans. AGU, 76 329, 1995.)] |
The source inversion is a multipass operation since a lower frequency filter band is used for larger earthquakes and since a search is made over depth. Up to three passed of the outer loop are made, after which the moment magnitude is determined and filter settings readjusted. The inner loop over depth samples all depths from 0 to 800 km with 5 km increments in depth to 50 km, followed by 10 km depth sampling for the remaining range.
The following filter ranges are used according to the moment magnitude Mw:
   FILTER_BAND   FH(s)  FL(s)
       1           60     12      Mw < 6.4
       2          100     20      6.4 < Mw <= 6.9
       3          120     40      Mw > 6.9
For this data set the favored solution is
WVFMTD96 620.0 47. 74. -100. 7.25 0.647 0.238E-05 0.647 0.831 0.238E-05 49.5
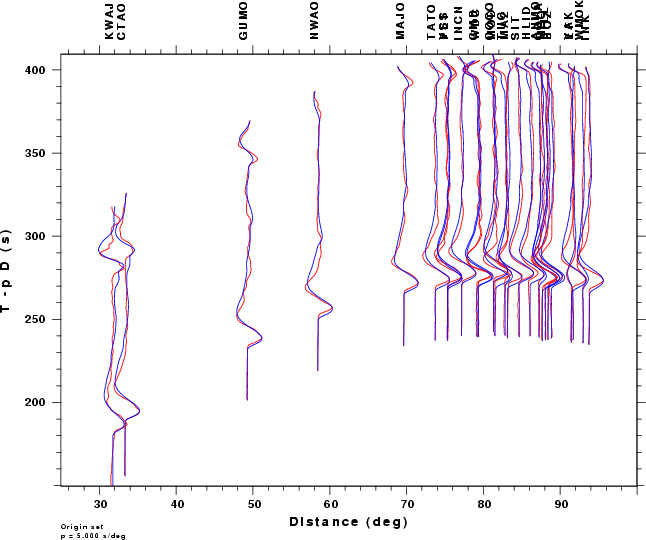
The following figures show the sensitivity of the goodness of fit parameter so source depth, the waveform comparison as a function of epicentral distance in degrees and the source to station azimuth
|
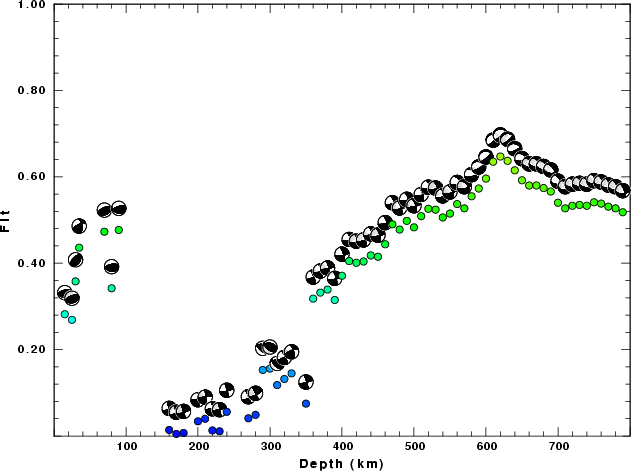
| Goodness of fit as a function of source depth. The measure is 1 - SUM (o -p)2 / SUM o2. A value of 1.0 is the best fit. The best double couple mechanism for the solution depth is plotted above goodness of fit value to indicate how the mefhanism may change with depth. |
|
|
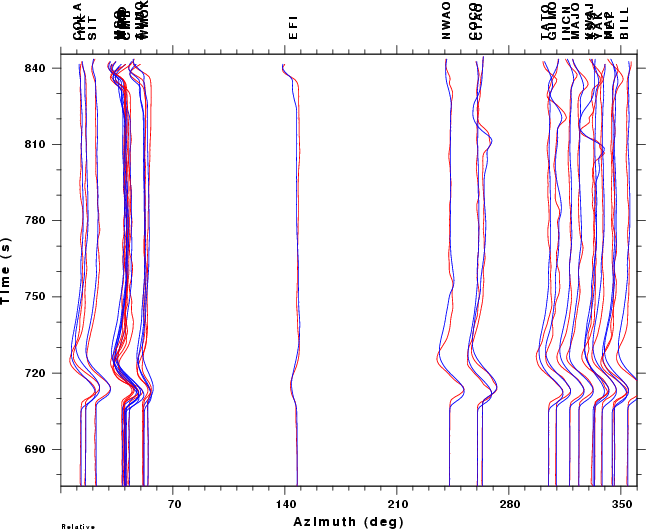
| Comparison of the observed traces (red) and solution predicted traces (blue) as a function of source to station azimuth in degrees (D). The purpose of this display is to highlight the azimuthal dependence on the first motion. The traces are annotated with the station name at the top. |