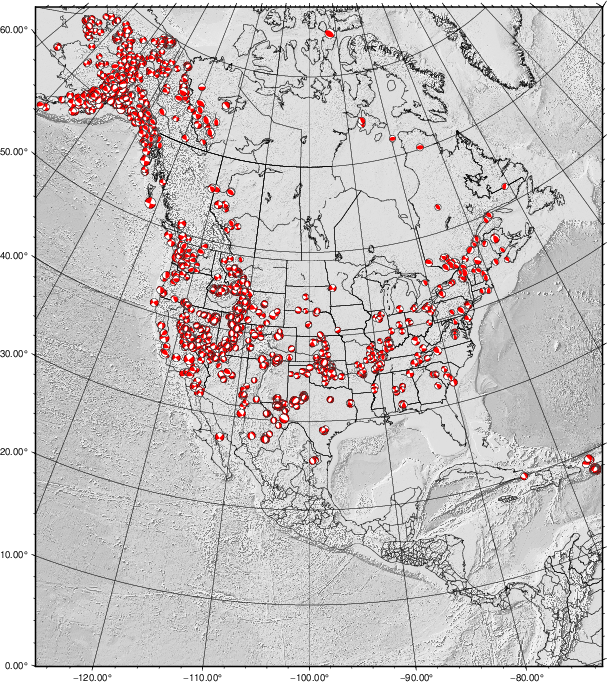
Moment tensors. The colored quadrant indicates compressional motion. The seismicity plot consists of all earthquakes with M greater than 3.0 in the combined ANSS and Geological Survey of Canada catalogs from 1999/01/01 through 2006/10/26
Orientation of tension axis onto the horizontal plane. The length and width indicate the degree that the axis is horizontal. A vertical axis has zero length in the plot. Red color indicates recent events. The seismicity plot consists of all earthquakes with M greater than 3.0 in the combined ANSS and Geological Survey of Canada catalogs from 1999/01/01 through 2006/10/26
Orientation of pressure axis onto the horizontal plane. The length and width indicate the degree that the axis is horizontal. A vertical axis has zero length in the plot. Red color indicates recent events. The seismicity plot consists of all earthquakes with M greater than 3.0 in the combined ANSS and Geological Survey of Canada catalogs from 1999/01/01 through 2006/10/26
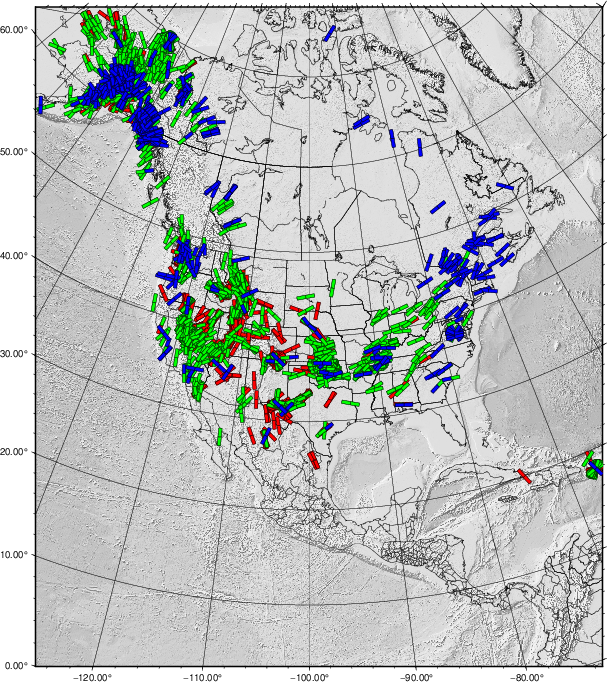
Orientation of maximum horizontal compressive stress following the convention of Zoback (1992) (Description of Stress Regime Assigment from WSM web page). Red indicates normal faulting, blue thrust faulting and green strike-slip faulting.
 
    P/S1-axis    B/S2-axis          T/S3-axis    Regime    SH-azimuth           
      pl > 52                        pl < 35       NF      azim. of B-axis      
 40 < pl < 52                        pl < 20       NS      azim. of T-axis +90  
      pl < 40     pl > 45            pl < 20       SS      azim. of T-axis +90  
      pl < 20     pl > 45            pl < 40       SS      azim. of P-axis      
      pl < 20                   40 < pl < 52       TS      azim. of P-axis      
      pl < 35                        pl > 52       TF      azim. of P-axis       

Last Changed "Wed Mar 13 16:55:00 UTC 2024"