2007/06/18 14:29:54 34.48N 50.84E 42 5.8 Iran
USGS Felt map for this earthquake
USGS Felt reports page for Iran
 SLU Moment Tensor Solution
 2007/06/18 14:29:54 34.48N 50.84E 42 5.8 Iran

 Best Fitting Double Couple
    Mo = 1.48e+24 dyne-cm
    Mw = 5.38
    Z  = 19 km
     Plane   Strike  Dip  Rake
      NP1      170    70    45
      NP2       61    48   153
 Principal Axes:
   Axis    Value   Plunge  Azimuth
     T   1.48e+24     45      35
     N   0.00e+00     42     189
     P  -1.48e+24     13     291


 Moment Tensor: (dyne-cm)
    Component  Value
       Mxx     3.16e+23
       Mxy     8.09e+23
       Mxz     4.91e+23
       Myy    -9.88e+23
       Myz     7.27e+23
       Mzz     6.72e+23


                     ---###########
                 ------################
              ---------###################
             ----------####################
           -----------#######################
          ------------###########   ##########
            ----------########### T ##########-
        - P ----------###########   ##########--
        -   ----------#######################---
       ---------------#######################----
       ----------------#####################-----
       ----------------###################-------
       ----------------##################--------
        ----------------###############---------
        ----------------#############-----------
         ----------------#########-------------
          ---------------######---------------
           ###-------------------------------
             ##############----------------
              ##############--------------
                 ############----------
                     ##########----


 Harvard Convention
 Moment Tensor:
      R          T          F
  6.72e+23   4.91e+23  -7.27e+23
  4.91e+23   3.16e+23  -8.09e+23
 -7.27e+23  -8.09e+23  -9.88e+23


Details of the solution is found at

http://www.eas.slu.edu/Earthquake_Center/MECH.IR/20070618142954/index.html
|
      STK = 170
      DIP = 70
     RAKE = 45
       MW = 5.38
       HS = 19.0
This only uses a sparse set of regional surface waves with a poor azimuthal distribution. This is not a good solution
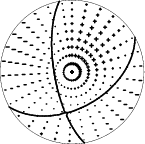
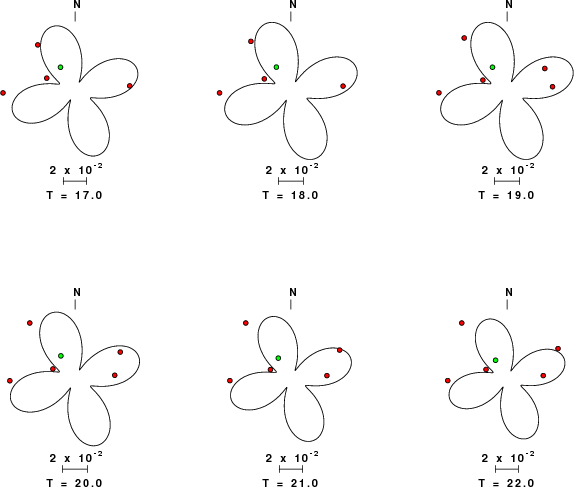
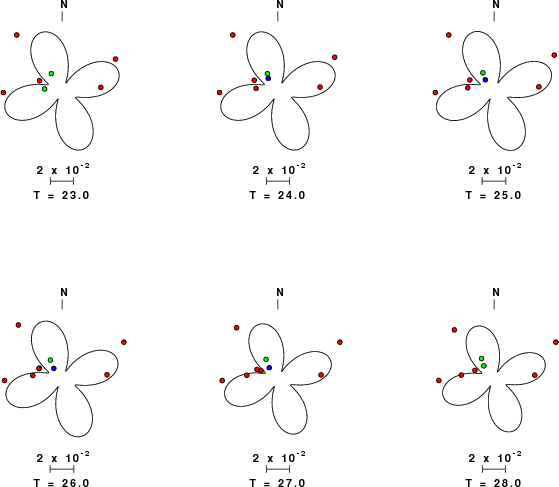
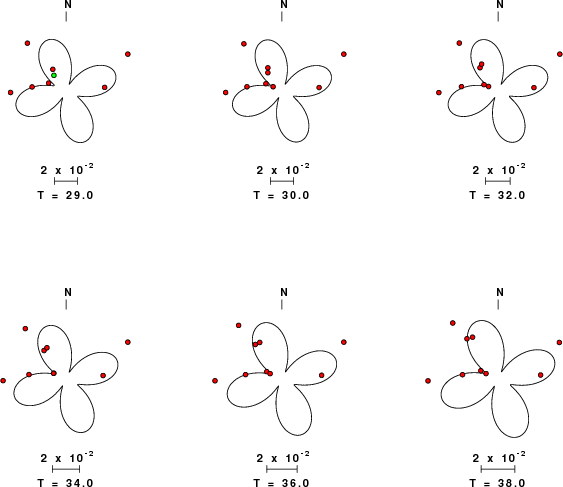
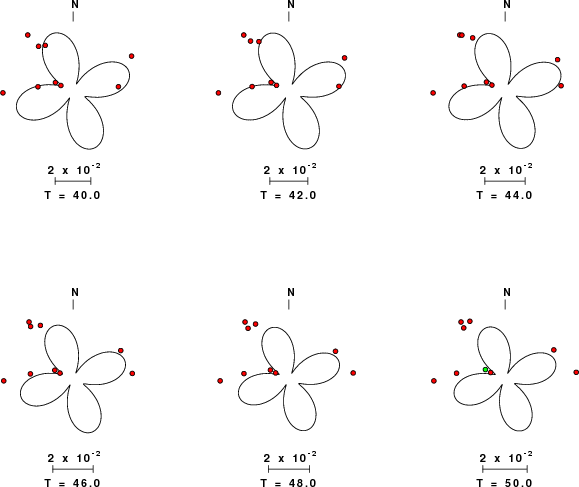
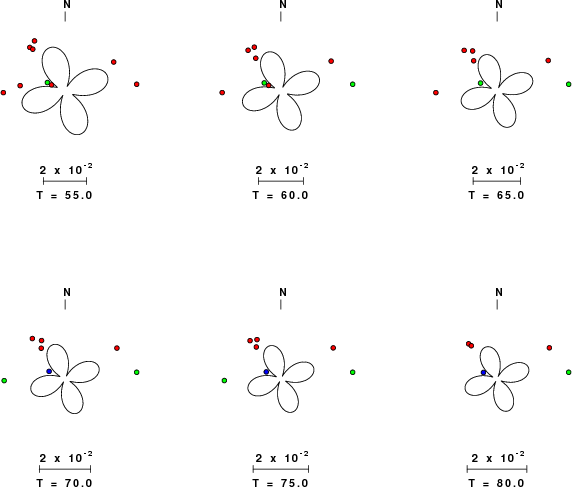
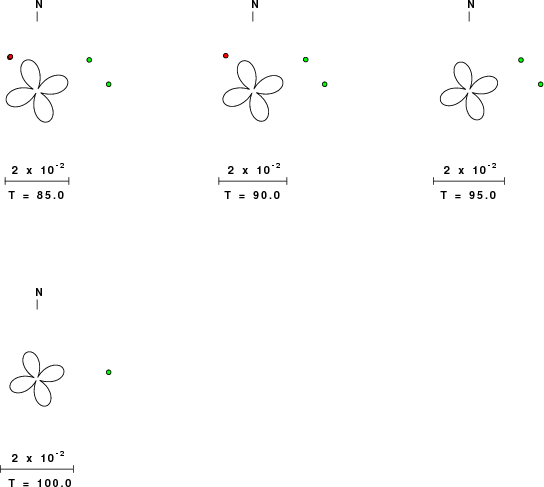
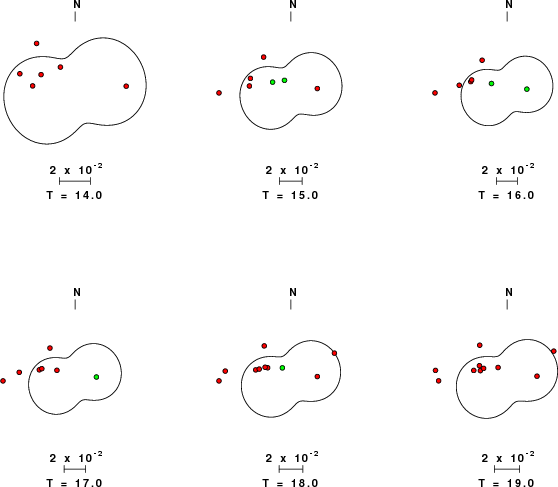
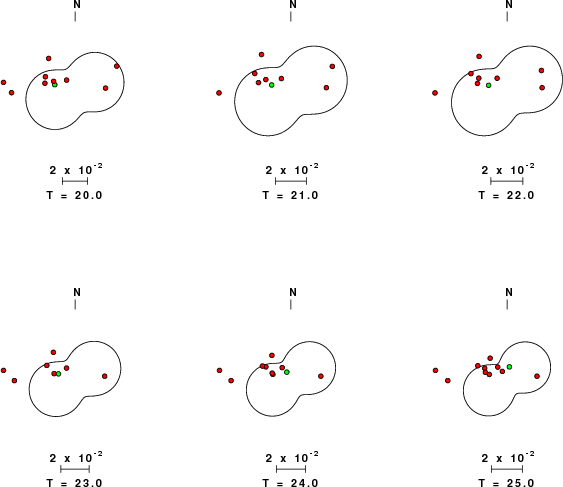
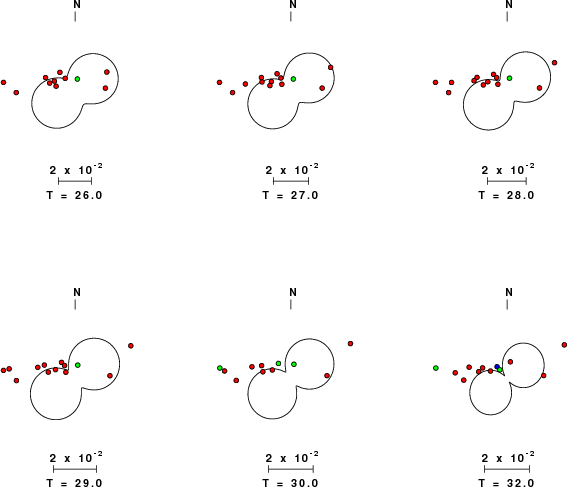
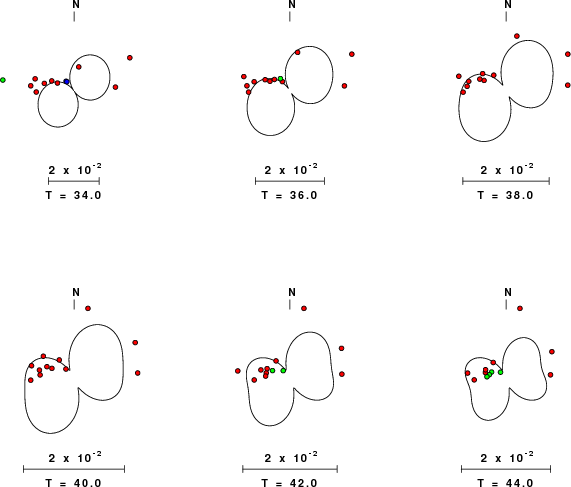
The following figure shows the stations used in the grid search for the best focal mechanism to fit the surface-wave spectral amplitudes of the Love and Rayleigh waves.
|
|
|
|
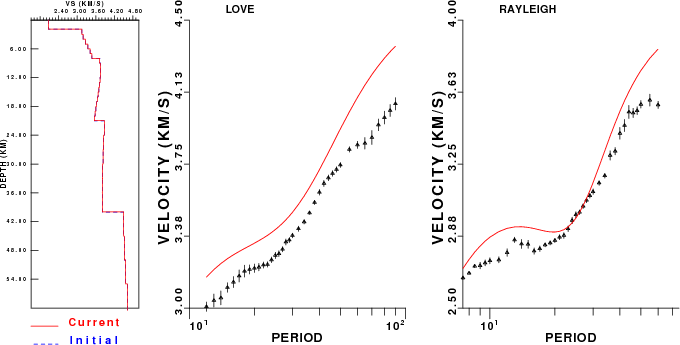
The surface-wave determined focal mechanism is shown here.
  NODAL PLANES


  STK=     169.99
  DIP=      70.00
 RAKE=      45.00

             OR

  STK=      61.11
  DIP=      48.36
 RAKE=     152.76


DEPTH = 19.0 km

Mw = 5.38
Best Fit 0.8494 - P-T axis plot gives solutions with FIT greater than FIT90
 |
The P-wave first motion data for focal mechanism studies are as follow:
Sta Az(deg) Dist(km) First motion
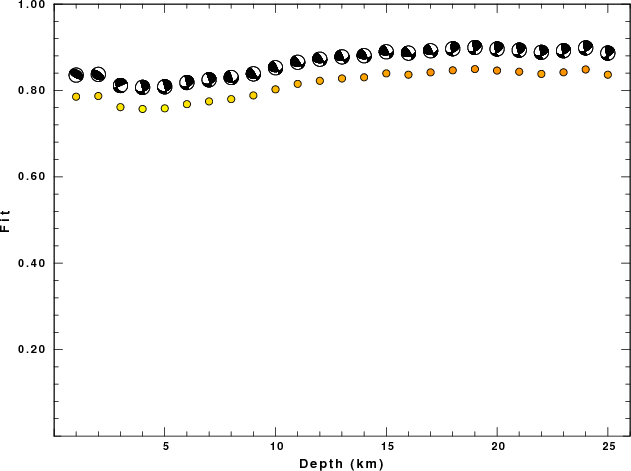
Surface wave analysis was performed using codes from Computer Programs in Seismology, specifically the multiple filter analysis program do_mft and the surface-wave radiation pattern search program srfgrd96.
Digital data were collected, instrument response removed and traces converted
to Z, R an T components. Multiple filter analysis was applied to the Z and T traces to obtain the Rayleigh- and Love-wave spectral amplitudes, respectively.
These were input to the search program which examined all depths between 1 and 25 km
and all possible mechanisms.
|
|
|
|
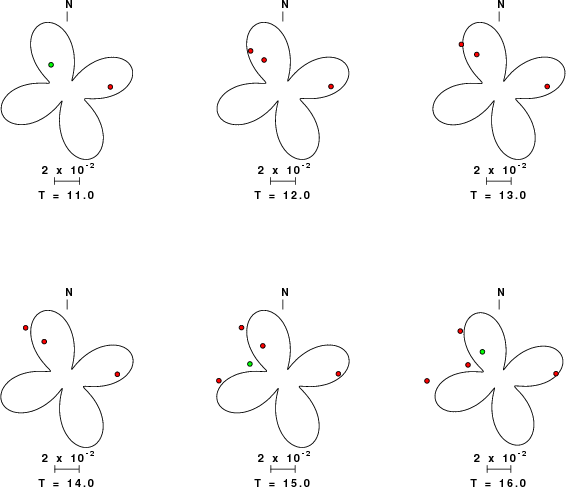
| Pressure-tension axis trends. Since the surface-wave spectra search does not distinguish between P and T axes and since there is a 180 ambiguity in strike, all possible P and T axes are plotted. First motion data and waveforms will be used to select the preferred mechanism. The purpose of this plot is to provide an idea of the possible range of solutions. The P and T-axes for all mechanisms with goodness of fit greater than 0.9 FITMAX (above) are plotted here. |
|
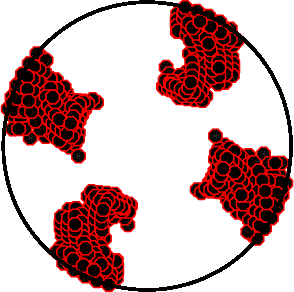
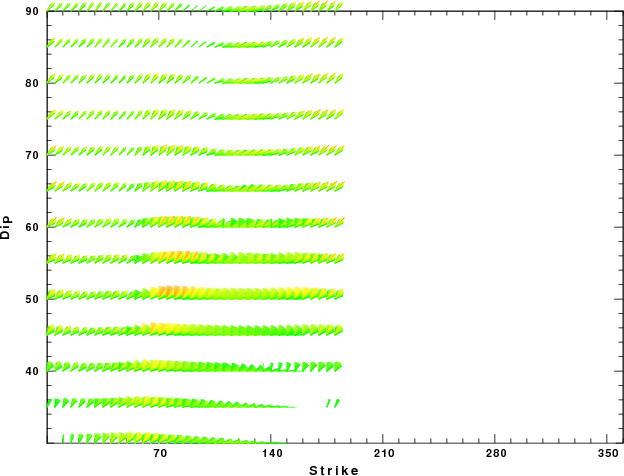
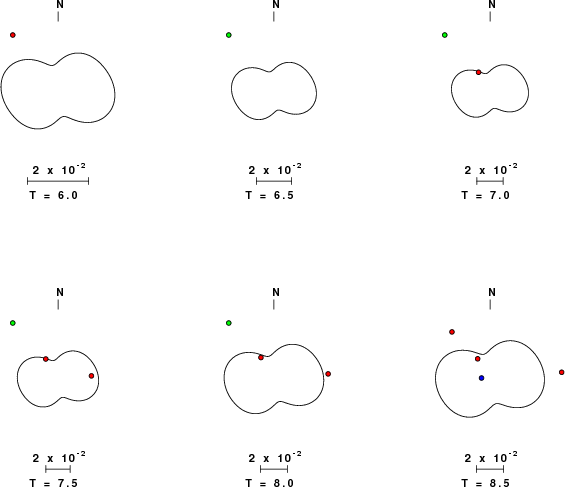
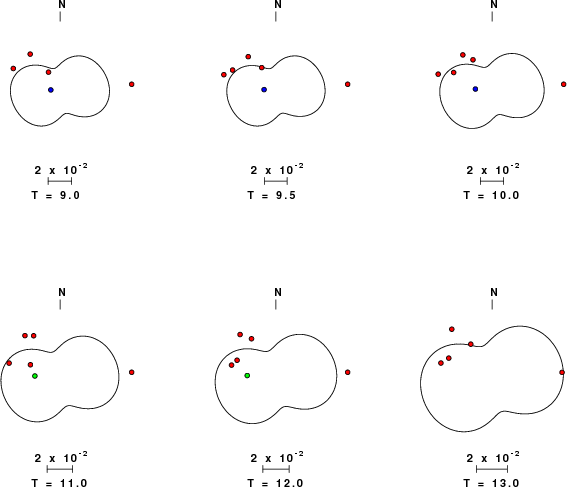
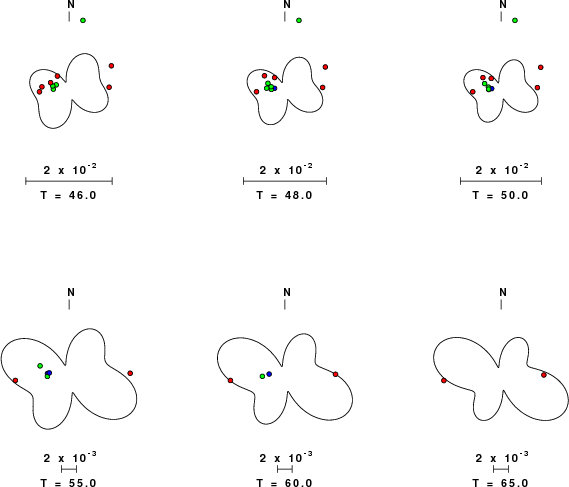
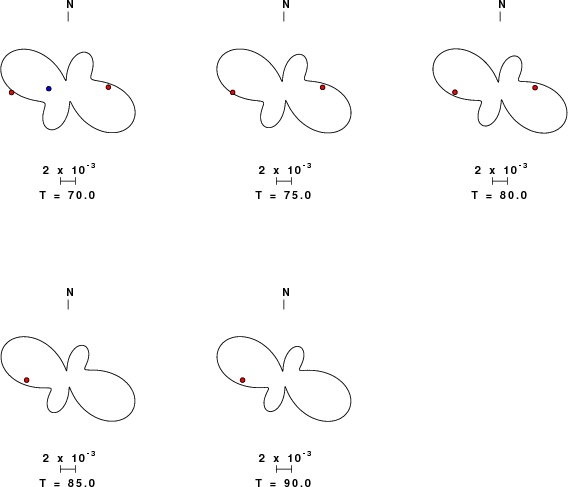
| Focal mechanism sensitivity at the preferred depth. The red color indicates a very good fit to the Love and Rayleigh wave radiation patterns. Each solution is plotted as a vector at a given value of strike and dip with the angle of the vector representing the rake angle, measured, with respect to the upward vertical (N) in the figure. Because of the symmetry of the spectral amplitude rediation patterns, only strikes from 0-180 degrees are sampled. |
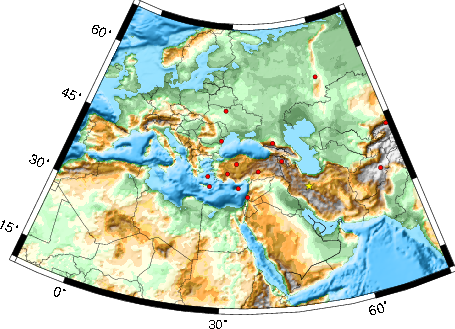
The distribution of broadband stations with azimuth and distance is
Sta Az(deg)    Dist(km)
GNI	  321	  829
MALT	  294	 1191
KIV	  329	 1264
KSDI	  268	 1411
CSS	  277	 1603
KBL	   85	 1669
ANTO	  296	 1707
ISP	  287	 1863
TIRR	  307	 2214
AAK	   59	 2242
ZKR	  279	 2249
APE	  284	 2300
ARU	   11	 2509
KIEV	  322	 2511
Since the analysis of the surface-wave radiation patterns uses only spectral amplitudes and because the surfave-wave radiation patterns have a 180 degree symmetry, each surface-wave solution consists of four possible focal mechanisms corresponding to the interchange of the P- and T-axes and a roation of the mechanism by 180 degrees. To select one mechanism, P-wave first motion can be used. This was not possible in this case because all the P-wave first motions were emergent ( a feature of the P-wave wave takeoff angle, the station location and the mechanism). The other way to select among the mechanisms is to compute forward synthetics and compare the observed and predicted waveforms.
The fits to the waveforms with the given mechanism are show below:

|
This figure shows the fit to the three components of motion (Z - vertical, R-radial and T - transverse). For each station and component, the observed traces is shown in red and the model predicted trace in blue. The traces represent filtered ground velocity in units of meters/sec (the peak value is printed adjacent to each trace; each pair of traces to plotted to the same scale to emphasize the difference in levels). Both synthetic and observed traces have been filtered using the SAC commands:
|
|
The WUS used for the waveform synthetic seismograms and for the surface wave eigenfunctions and dispersion is as follows:
MODEL.01
Model after     8 iterations
ISOTROPIC
KGS
FLAT EARTH
1-D
CONSTANT VELOCITY
LINE08
LINE09
LINE10
LINE11
      H(KM)   VP(KM/S)   VS(KM/S) RHO(GM/CC)         QP         QS       ETAP       ETAS      FREFP      FREFS
     1.9000     3.4065     2.0089     2.2150  0.302E-02  0.679E-02   0.00       0.00       1.00       1.00
     6.1000     5.5445     3.2953     2.6089  0.349E-02  0.784E-02   0.00       0.00       1.00       1.00
    13.0000     6.2708     3.7396     2.7812  0.212E-02  0.476E-02   0.00       0.00       1.00       1.00
    19.0000     6.4075     3.7680     2.8223  0.111E-02  0.249E-02   0.00       0.00       1.00       1.00
     0.0000     7.9000     4.6200     3.2760  0.164E-10  0.370E-10   0.00       0.00       1.00       1.00
Here we tabulate the reasons for not using certain digital data sets