
2008/02/28 15:10:39 41.036 -114.897 10.0 3.9 Nevada
USGS Felt map for this earthquake
 SLU Moment Tensor Solution
 2008/02/28 15:10:39 41.036 -114.897 10.0 3.9 Nevada

 Best Fitting Double Couple
    Mo = 1.17e+22 dyne-cm
    Mw = 3.98
    Z  = 10 km
     Plane   Strike  Dip  Rake
      NP1       22    61   -118
      NP2      250    40   -50
 Principal Axes:
   Axis    Value   Plunge  Azimuth
     T   1.17e+22     11     132
     N   0.00e+00     24      37
     P  -1.17e+22     63     245


 Moment Tensor: (dyne-cm)
    Component  Value
       Mxx     4.71e+21
       Mxy    -6.57e+21
       Mxz     5.10e+20
       Myy     4.16e+21
       Myz     5.97e+21
       Mzz    -8.86e+21


                     ##############
                 ####################--
              #######################-----
             ########################------
           ##############-------------##-----
          ##########------------------######--
         ########---------------------########-
        #######----------------------###########
        #####------------------------###########
       #####-------------------------############
       ####-------------------------#############
       ###----------   -------------#############
       ##----------- P ------------##############
        #-----------   -----------##############
        #------------------------###############
         -----------------------###############
          ---------------------#########   ###
           -------------------########## T ##
             ---------------############
              ------------################
                 ------################
                     ##############


 Harvard Convention
 Moment Tensor:
      R          T          F
 -8.86e+21   5.10e+20  -5.97e+21
  5.10e+20   4.71e+21   6.57e+21
 -5.97e+21   6.57e+21   4.16e+21


Details of the solution is found at

http://www.eas.slu.edu/Earthquake_Center/MECH.NA/20080228151039/index.html
|
      STK = 250
      DIP = 40
     RAKE = -50
       MW = 3.98
       HS = 10.0
The waveform inversion is preferred.
The following compares this source inversion to others
 SLU Moment Tensor Solution
 2008/02/28 15:10:39 41.036 -114.897 10.0 3.9 Nevada

 Best Fitting Double Couple
    Mo = 1.17e+22 dyne-cm
    Mw = 3.98
    Z  = 10 km
     Plane   Strike  Dip  Rake
      NP1       22    61   -118
      NP2      250    40   -50
 Principal Axes:
   Axis    Value   Plunge  Azimuth
     T   1.17e+22     11     132
     N   0.00e+00     24      37
     P  -1.17e+22     63     245


 Moment Tensor: (dyne-cm)
    Component  Value
       Mxx     4.71e+21
       Mxy    -6.57e+21
       Mxz     5.10e+20
       Myy     4.16e+21
       Myz     5.97e+21
       Mzz    -8.86e+21


                     ##############
                 ####################--
              #######################-----
             ########################------
           ##############-------------##-----
          ##########------------------######--
         ########---------------------########-
        #######----------------------###########
        #####------------------------###########
       #####-------------------------############
       ####-------------------------#############
       ###----------   -------------#############
       ##----------- P ------------##############
        #-----------   -----------##############
        #------------------------###############
         -----------------------###############
          ---------------------#########   ###
           -------------------########## T ##
             ---------------############
              ------------################
                 ------################
                     ##############


 Harvard Convention
 Moment Tensor:
      R          T          F
 -8.86e+21   5.10e+20  -5.97e+21
  5.10e+20   4.71e+21   6.57e+21
 -5.97e+21   6.57e+21   4.16e+21


Details of the solution is found at

http://www.eas.slu.edu/Earthquake_Center/MECH.NA/20080228151039/index.html
|
The focal mechanism was determined using broadband seismic waveforms. The location of the event and the and stations used for the waveform inversion are shown in the next figure.
|
|
|
|
The program wvfgrd96 was used with good traces observed at short distance to determine the focal mechanism, depth and seismic moment. This technique requires a high quality signal and well determined velocity model for the Green functions. To the extent that these are the quality data, this type of mechanism should be preferred over the radiation pattern technique which requires the separate step of defining the pressure and tension quadrants and the correct strike.
The observed and predicted traces are filtered using the following gsac commands:
hp c 0.02 n 3
lp c 0.10 n 3
The results of this grid search from 0.5 to 19 km depth are as follow:
           DEPTH  STK   DIP  RAKE   MW    FIT
WVFGRD96    0.5   220    45   -90   3.59 0.2571
WVFGRD96    1.0   270    90    -5   3.49 0.2136
WVFGRD96    2.0    85    65   -20   3.65 0.2567
WVFGRD96    3.0   100    30    10   3.78 0.2894
WVFGRD96    4.0   270    30   -10   3.81 0.3507
WVFGRD96    5.0   260    30   -30   3.84 0.3996
WVFGRD96    6.0   260    35   -30   3.85 0.4353
WVFGRD96    7.0   255    35   -40   3.87 0.4597
WVFGRD96    8.0   250    35   -45   3.95 0.4791
WVFGRD96    9.0   250    35   -50   3.97 0.4899
WVFGRD96   10.0   250    40   -50   3.98 0.4926
WVFGRD96   11.0   250    40   -50   3.99 0.4868
WVFGRD96   12.0   255    40   -40   3.99 0.4761
WVFGRD96   13.0   260    45   -35   4.00 0.4623
WVFGRD96   14.0   260    45   -35   4.01 0.4458
WVFGRD96   15.0   260    45   -30   4.02 0.4273
WVFGRD96   16.0   260    45   -30   4.02 0.4073
WVFGRD96   17.0   265    45   -25   4.03 0.3862
WVFGRD96   18.0   265    45   -25   4.03 0.3649
WVFGRD96   19.0   265    45   -20   4.04 0.3438
WVFGRD96   20.0   265    45   -20   4.04 0.3228
WVFGRD96   21.0   265    45   -20   4.05 0.3030
WVFGRD96   22.0   265    45   -20   4.05 0.2830
WVFGRD96   23.0   265    45   -20   4.05 0.2643
WVFGRD96   24.0   265    50   -20   4.06 0.2471
WVFGRD96   25.0   265    50   -20   4.06 0.2316
WVFGRD96   26.0   190    75    50   4.06 0.2210
WVFGRD96   27.0   190    75    45   4.06 0.2153
WVFGRD96   28.0   190    75    45   4.07 0.2099
WVFGRD96   29.0   185    80    45   4.07 0.2051
The best solution is
WVFGRD96 10.0 250 40 -50 3.98 0.4926
The mechanism correspond to the best fit is

|
|
|
The best fit as a function of depth is given in the following figure:

|
|
|
The comparison of the observed and predicted waveforms is given in the next figure. The red traces are the observed and the blue are the predicted. Each observed-predicted componnet is plotted to the same scale and peak amplitudes are indicated by the numbers to the left of each trace. The number in black at the rightr of each predicted traces it the time shift required for maximum correlation between the observed and predicted traces. This time shift is required because the synthetics are not computed at exactly the same distance as the observed and because the velocity model used in the predictions may not be perfect. A positive time shift indicates that the prediction is too fast and should be delayed to match the observed trace (shift to the right in this figure). A negative value indicates that the prediction is too slow. The bandpass filter used in the processing and for the display was
hp c 0.02 n 3
lp c 0.10 n 3

|
|
|

|
| Focal mechanism sensitivity at the preferred depth. The red color indicates a very good fit to thewavefroms. Each solution is plotted as a vector at a given value of strike and dip with the angle of the vector representing the rake angle, measured, with respect to the upward vertical (N) in the figure. |
The following figure shows the stations used in the grid search for the best focal mechanism to fit the surface-wave spectral amplitudes of the Love and Rayleigh waves.

|
|
|
The surface-wave determined focal mechanism is shown here.
  NODAL PLANES


  STK=      30.00
  DIP=      59.99
 RAKE=    -115.00

             OR

  STK=     253.00
  DIP=      38.29
 RAKE=     -53.80


DEPTH = 8.0 km

Mw = 4.07
Best Fit 0.9117 - P-T axis plot gives solutions with FIT greater than FIT90
 |
The P-wave first motion data for focal mechanism studies are as follow:
Sta Az(deg)    Dist(km)   First motion
N12A      210   24 -12345
ELK       222   43 -12345
N13A      109   62 -12345
M13A       59   71 -12345
N11A      251   75 -12345
O12A      171   86 -12345
M11A      301   87 -12345
O11A      213  119 -12345
L12A      355  124 -12345
O13A      142  127 -12345
M14A       68  140 -12345
L13A       34  141 -12345
L11A      331  145 -12345
N14A       98  145 -12345
M10A      292  148 -12345
BGU        94  158 -12345
L10A      312  175 -12345
L14A       51  177 -12345
K12A      360  178 -12345
P11A      204  180 -12345
K13A       20  191 -12345
P13A      157  191 -12345
DUG       117  200 -12345
N15A       94  201 -12345
SPU        81  208 -12345
M15A       76  211 -12345
O09A      244  217 -12345
M09A      282  218 -12345
K14A       40  220 -12345
N09A      266  222 -12345
O15A      111  222 -12345
Q12A      178  222 -12345
P14A      135  223 -12345
L15A       62  236 -12345
Q13A      162  243 -12345
P09A      230  252 -12345
Q11A      195  252 -12345
K10A      320  253 -12345
L09A      296  256 -12345
Q14A      148  266 -12345
NLU       116  268 -12345
J13A       13  269 -12345
K15A       46  269 -12345
N08A      265  274 -12345
M16A       82  276 -12345
P15A      125  276 -12345
Q10A      208  277 -12345
J14A       24  278 -12345
HLID        8  283 -12345
O08A      254  288 -12345
N16A       92  292 -12345
M08A      280  295 -12345
K09A      309  299 -12345
MPU       111  299 -12345
R12A      175  302 -12345
R11A      191  304 -12345
L16A       68  309 -12345
Q15A      136  312 -12345
Q09A      219  313 -12345
L08A      295  315 -12345
I13A       11  326 -12345
R13A      166  327 -12345
I11A      345  331 -12345
K16A       53  339 -12345
N17A       90  342 -12345
I14A       20  343 -12345
N07B      267  344 -12345
R14A      151  344 -12345
WVOR      298  348 -12345
O07A      255  351 -12345
K08A      303  352 -12345
Q08A      228  354 -12345
L17A       69  356 -12345
M17A       81  358 -12345
M07A      278  361 -12345
O17A      104  364 -12345
AHID       57  369 -12345
K17A       59  381 -12345
I15A       30  384 -12345
L07A      288  386 -12345
P17A      115  394 -12345
S13A      167  394 -12345
M18A       82  407 -12345
N06A      267  417 -12345
L18A       75  418 -12345
O18A      100  422 -12345
T11A      184  422 -12345
J17A       52  432 -12345
K18A       65  441 -12345
G13A        7  454 -12345
J18A       57  470 -12345
Surface wave analysis was performed using codes from Computer Programs in Seismology, specifically the multiple filter analysis program do_mft and the surface-wave radiation pattern search program srfgrd96.
Digital data were collected, instrument response removed and traces converted
to Z, R an T components. Multiple filter analysis was applied to the Z and T traces to obtain the Rayleigh- and Love-wave spectral amplitudes, respectively.
These were input to the search program which examined all depths between 1 and 25 km
and all possible mechanisms.

|
|
|

|
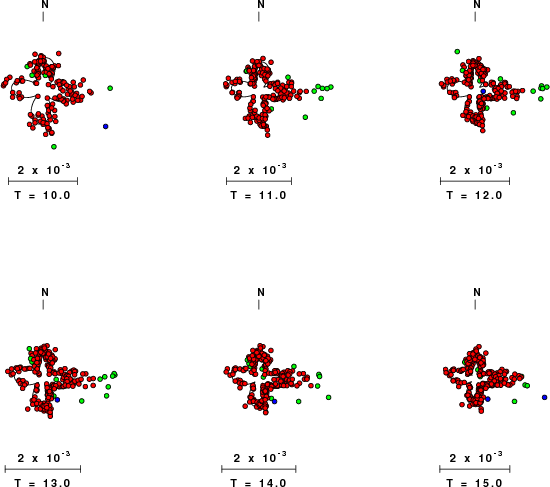
| Pressure-tension axis trends. Since the surface-wave spectra search does not distinguish between P and T axes and since there is a 180 ambiguity in strike, all possible P and T axes are plotted. First motion data and waveforms will be used to select the preferred mechanism. The purpose of this plot is to provide an idea of the possible range of solutions. The P and T-axes for all mechanisms with goodness of fit greater than 0.9 FITMAX (above) are plotted here. |

|
| Focal mechanism sensitivity at the preferred depth. The red color indicates a very good fit to the Love and Rayleigh wave radiation patterns. Each solution is plotted as a vector at a given value of strike and dip with the angle of the vector representing the rake angle, measured, with respect to the upward vertical (N) in the figure. Because of the symmetry of the spectral amplitude rediation patterns, only strikes from 0-180 degrees are sampled. |
The distribution of broadband stations with azimuth and distance is
Sta Az(deg)    Dist(km)
O11A	  213	  119
L12A	  355	  124
M14A	   68	  140
N10A	  256	  140
L13A	   34	  141
L11A	  331	  144
N14A	   98	  145
M10A	  292	  148
BGU	   94	  158
L10A	  312	  175
L14A	   51	  177
K12A	  360	  178
P11A	  204	  180
K13A	   20	  191
P13A	  157	  191
HVU	   64	  196
DUG	  117	  200
N15A	   94	  201
P10A	  221	  206
SPU	   81	  208
M15A	   76	  211
K11A	  334	  215
O09A	  244	  217
M09A	  282	  218
K14A	   40	  220
N09A	  266	  222
O15A	  111	  222
Q12A	  178	  222
L15A	   62	  236
NOQ	   99	  238
Q13A	  162	  243
J12A	  356	  246
P09A	  230	  252
Q11A	  195	  252
K10A	  320	  253
L09A	  296	  256
Q14A	  148	  266
CTU	   97	  268
NLU	  116	  268
J13A	   13	  269
K15A	   46	  269
N08A	  265	  274
J11A	  344	  275
M16A	   82	  276
P15A	  125	  276
Q10A	  208	  277
J14A	   24	  278
HLID	    8	  283
O08A	  254	  288
N16A	   92	  292
M08A	  280	  295
K09A	  309	  299
MPU	  111	  299
R12A	  175	  302
R11A	  191	  304
J10A	  330	  307
L16A	   68	  309
Q15A	  136	  312
Q09A	  219	  313
L08A	  295	  315
P16A	  119	  317
I13A	   11	  326
R13A	  166	  327
R10A	  202	  328
I11A	  345	  331
J15A	   37	  332
K16A	   53	  339
N17A	   90	  342
I14A	   20	  343
N07B	  267	  344
R14A	  152	  344
WVOR	  298	  348
J09A	  318	  349
O07A	  255	  351
K08A	  304	  352
Q08A	  228	  354
L17A	   69	  356
M17A	   81	  358
M07A	  278	  361
R09A	  212	  362
O17A	  104	  364
J16A	   46	  368
AHID	   57	  369
TMU	  120	  369
I10A	  336	  373
S10A	  204	  375
P07A	  245	  378
K17A	   59	  381
S12A	  179	  381
I15A	   30	  384
S11A	  191	  384
L07A	  288	  386
R15A	  144	  386
H12A	    0	  390
RRI2	   48	  391
J08A	  312	  392
S14A	  157	  393
P17A	  115	  394
S13A	  167	  394
H13A	    7	  395
Q16A	  125	  396
I09A	  325	  401
K07A	  298	  405
R08A	  224	  406
M18A	   82	  407
CCUT	  161	  409
H11A	  348	  417
N06A	  267	  417
DCID1	   46	  418
L18A	   75	  418
S09A	  209	  419
I16A	   40	  422
O18A	  100	  422
REDW	   51	  422
T11A	  184	  422
H10A	  340	  423
R16A	  135	  423
P18A	  110	  425
TPAW	   49	  425
O06A	  259	  428
SRU	  118	  430
J17A	   52	  432
S15A	  149	  432
SNOW	   50	  435
H15A	   24	  438
I08A	  318	  439
K18A	   65	  441
J07A	  307	  447
P06A	  252	  451
G13A	    7	  454
T13A	  169	  454
IMW	   44	  455
LOHW	   50	  455
Q18A	  116	  460
H09A	  332	  462
R17A	  128	  462
BMO	  336	  467
T14A	  160	  468
J18A	   58	  470
L19A	   74	  477
I17A	   46	  478
T12A	  178	  479
R06C	  236	  480
G14A	   14	  482
N19A	   90	  482
BW06	   65	  483
M19A	   82	  484
H08A	  323	  495
O19A	   98	  495
T15A	  153	  496
G15A	   22	  499
J06A	  301	  499
H16A	   35	  505
G10A	  340	  506
I07A	  313	  507
I18A	   53	  512
U12A	  176	  512
U11A	  185	  514
DLMT	   20	  516
S17A	  136	  517
U13A	  171	  519
R18A	  123	  520
F12A	  357	  525
G09A	  334	  526
P19A	  105	  526
U10A	  194	  527
G16A	   27	  529
K05A	  293	  532
Q19A	  114	  534
U14A	  163	  534
T16A	  146	  537
K19A	   66	  540
I06A	  308	  543
F14A	   13	  545
F11A	  350	  549
L20A	   77	  558
N20A	   90	  559
S18A	  130	  562
M20A	   83	  564
F15A	   19	  568
R19A	  120	  571
T17A	  140	  571
O20A	   98	  572
G08A	  326	  576
BOZ	   26	  577
P20A	  105	  579
V11A	  185	  579
F10A	  342	  580
V13A	  172	  581
G17A	   34	  584
V12A	  180	  589
F16A	   26	  590
E11A	  350	  600
E13A	    5	  603
H06A	  315	  605
E14A	   10	  608
G07A	  322	  609
Q20A	  110	  609
T18A	  133	  613
U17A	  142	  614
F08A	  331	  615
S19A	  124	  616
V14A	  165	  620
N21A	   90	  622
E15A	   16	  626
V15A	  157	  626
E10A	  344	  631
M21A	   82	  634
U16A	  148	  634
O21A	   96	  635
L21A	   78	  637
W12A	  180	  637
F17A	   31	  640
G18A	   41	  643
R20A	  117	  643
RLMT	   43	  645
MSO	    6	  648
LDF	  182	  656
GSC	  195	  658
G06A	  317	  660
E09A	  338	  662
E16A	   22	  663
W13A	  172	  665
W14A	  166	  666
Q21A	  109	  672
ISA	  209	  673
U18A	  138	  673
D13A	    3	  674
F07A	  325	  676
D11A	  351	  678
D14A	    9	  681
E17A	   27	  685
W15A	  160	  690
T19A	  131	  691
HUMO	  287	  692
D10A	  345	  695
M22A	   84	  697
G05A	  314	  700
HAWA	  330	  702
LTH	  330	  704
F06A	  320	  709
N22A	   89	  711
D16A	   21	  718
H04A	  307	  720
X13A	  172	  721
W16A	  155	  722
D09A	  339	  723
Q22A	  107	  724
E07A	  329	  732
E18A	   31	  733
V18A	  142	  733
C13A	    2	  739
SAO	  232	  740
D08A	  336	  742
C12B	  357	  743
X14A	  166	  750
MCCM	  248	  757
D17A	   25	  758
X15A	  161	  764
R22A	  111	  765
C15A	   13	  771
G04A	  309	  771
C10A	  346	  778
V19A	  137	  781
E06A	  323	  783
OSI	  206	  788
C16A	   17	  792
COR	  303	  792
PHWY	   85	  792
D07A	  331	  795
X16A	  156	  795
W18A	  144	  797
C09A	  342	  798
ISCO	   97	  799
C17A	   23	  803
Y14A	  167	  805
MWC	  201	  806
Y13A	  173	  807
Y12C	  178	  809
B13A	    2	  816
W19A	  142	  816
Y15A	  163	  818
C08A	  338	  819
NEW	  348	  822
T22A	  120	  823
X17A	  153	  826
B10A	  348	  828
B12A	  356	  828
B15A	   12	  829
B11A	  352	  831
D06A	  327	  833
X18A	  147	  843
C07A	  333	  846
Y16A	  158	  850
B16A	   16	  858
B09A	  344	  860
W20A	  137	  863
B17A	   20	  869
Z14A	  168	  869
EGMT	   26	  877
Z13A	  172	  877
A13A	    2	  878
A12A	  356	  880
B08A	  338	  886
F03A	  311	  886
GLA	  180	  886
SDCO	  111	  887
A11A	  353	  888
D05A	  323	  888
A14A	    7	  890
Y17A	  155	  890
Z15A	  163	  893
C06A	  330	  901
A10A	  348	  907
Z16A	  159	  908
B18A	   25	  912
W21A	  134	  914
B07A	  335	  922
113A	  173	  923
109C	  193	  925
D04A	  320	  925
E03A	  314	  927
A09A	  343	  929
Y19A	  146	  930
114A	  168	  937
LAO	   45	  937
112A	  178	  944
Z17A	  154	  944
RSSD	   65	  954
115A	  165	  955
SNCC	  207	  957
A18A	   23	  962
W22A	  131	  966
B06A	  330	  981
116A	  162	  982
Z18A	  152	  982
A07A	  336	  989
Z19A	  148	  994
ANMO	  130	 1002
X22A	  134	 1003
117A	  157	 1010
214A	  169	 1025
TUC	  158	 1035
119A	  150	 1044
Y22D	  135	 1044
216A	  162	 1048
A05A	  330	 1050
OGNE	   86	 1082
217A	  159	 1091
120A	  147	 1095
218A	  155	 1095
121A	  144	 1136
122A	  140	 1161
220A	  149	 1162
DGMT	   42	 1181
319A	  153	 1184
221A	  145	 1186
222A	  142	 1211
CBKS	   96	 1317
324A	  140	 1342
AMTX	  116	 1345
ECSD	   73	 1532
KSU1	   92	 1572
WMOK	  111	 1577
EYMN	   60	 2004
MIAR	  104	 2005
CCM	  248	 2053
UALR	  102	 2094
HKT	  120	 2113
FVM	   91	 2124
COWI	   66	 2145
HDIL	   83	 2154
KVTX	  129	 2158
OLIL	   88	 2297
OXF	  100	 2349
USIN	   89	 2357
VBMS	  106	 2379
BLO	   86	 2418
PLAL	   97	 2438
WCI	   88	 2464
GLMI	   70	 2492
AAM	   76	 2591
BRAL	  105	 2721
TZTN	   90	 2753
GOGA	   97	 2897
BLA	   87	 2992
Since the analysis of the surface-wave radiation patterns uses only spectral amplitudes and because the surfave-wave radiation patterns have a 180 degree symmetry, each surface-wave solution consists of four possible focal mechanisms corresponding to the interchange of the P- and T-axes and a roation of the mechanism by 180 degrees. To select one mechanism, P-wave first motion can be used. This was not possible in this case because all the P-wave first motions were emergent ( a feature of the P-wave wave takeoff angle, the station location and the mechanism). The other way to select among the mechanisms is to compute forward synthetics and compare the observed and predicted waveforms.
The fits to the waveforms with the given mechanism are show below:

|
This figure shows the fit to the three components of motion (Z - vertical, R-radial and T - transverse). For each station and component, the observed traces is shown in red and the model predicted trace in blue. The traces represent filtered ground velocity in units of meters/sec (the peak value is printed adjacent to each trace; each pair of traces to plotted to the same scale to emphasize the difference in levels). Both synthetic and observed traces have been filtered using the SAC commands:
hp c 0.02 n 3
lp c 0.10 n 3

|

|
Should the national backbone of the USGS Advanced National Seismic System (ANSS) be implemented with an interstation separation of 300 km, it is very likely that an earthquake such as this would have been recorded at distances on the order of 100-200 km. This means that the closest station would have information on source depth and mechanism that was lacking here.
Dr. Harley Benz, USGS, provided the USGS USNSN digital data. The digital data used in this study were provided by Natural Resources Canada through their AUTODRM site http://www.seismo.nrcan.gc.ca/nwfa/autodrm/autodrm_req_e.php, and IRIS using their BUD interface.
Thanks also to the many seismic network operators whose dedication make this effort possible: University of Alaska, University of Washington, Oregon State University, University of Utah, Montana Bureas of Mines, UC Berkely, Caltech, UC San Diego, Saint L ouis University, Universityof Memphis, Lamont Doehrty Earth Observatory, Boston College, the Iris stations and the Transportable Array of EarthScope.
The WUS.REG used for the waveform synthetic seismograms and for the surface wave eigenfunctions and dispersion is as follows:
MODEL.01
Model after     8 iterations
ISOTROPIC
KGS
FLAT EARTH
1-D
CONSTANT VELOCITY
LINE08
LINE09
LINE10
LINE11
      H(KM)   VP(KM/S)   VS(KM/S) RHO(GM/CC)         QP         QS       ETAP       ETAS      FREFP      FREFS
     1.9000     3.4065     2.0089     2.2150  0.302E-02  0.679E-02   0.00       0.00       1.00       1.00
     6.1000     5.5445     3.2953     2.6089  0.349E-02  0.784E-02   0.00       0.00       1.00       1.00
    13.0000     6.2708     3.7396     2.7812  0.212E-02  0.476E-02   0.00       0.00       1.00       1.00
    19.0000     6.4075     3.7680     2.8223  0.111E-02  0.249E-02   0.00       0.00       1.00       1.00
     0.0000     7.9000     4.6200     3.2760  0.164E-10  0.370E-10   0.00       0.00       1.00       1.00
Here we tabulate the reasons for not using certain digital data sets
The following stations did not have a valid response files:
DATE=Thu Feb 28 16:03:15 CST 2008