
2007/08/06 05:59:45 37.811 -114.433 5.0 4.1 Nevada
USGS Felt map for this earthquake
 SLU Moment Tensor Solution
 2007/08/06 05:59:45 37.811 -114.433 5.0 4.1 Nevada

 Best Fitting Double Couple
    Mo = 8.04e+21 dyne-cm
    Mw = 3.87
    Z  = 8 km
     Plane   Strike  Dip  Rake
      NP1       14    82   145
      NP2      110    55    10
 Principal Axes:
   Axis    Value   Plunge  Azimuth
     T   8.04e+21     30     326
     N   0.00e+00     54     183
     P  -8.04e+21     18      67


 Moment Tensor: (dyne-cm)
    Component  Value
       Mxx     3.01e+21
       Mxy    -5.39e+21
       Mxz     2.00e+21
       Myy    -4.32e+21
       Myz    -4.10e+21
       Mzz     1.31e+21


                     ############--
                 ################------
              ###################---------
             #####   ############----------
           ####### T ############------------
          ########   ###########--------------
         #######################----------   --
        -#######################---------- P ---
        -######################-----------   ---
       ---#####################------------------
       -----##################-------------------
       ------#################-------------------
       --------##############--------------------
        ----------###########-------------------
        -------------#######--------------------
         ----------------###-----------------##
          -----------------######------#######
           ----------------##################
             -------------#################
              -----------#################
                 -------###############
                     --############


 Harvard Convention
 Moment Tensor:
      R          T          F
  1.31e+21   2.00e+21   4.10e+21
  2.00e+21   3.01e+21   5.39e+21
  4.10e+21   5.39e+21  -4.32e+21


Details of the solution is found at

http://www.eas.slu.edu/eqc/eqc_mt/MECH.NA/20070806055945/index.html
|
      STK = 110
      DIP = 55
     RAKE = 10
       MW = 3.87
       HS = 8
The two techniques give similar solutiosn. The waveforms inversion is preferred.
The focal mechanism was determined using broadband seismic waveforms. The location of the event and the and stations used for the waveform inversion are shown in the next figure.
|
|
|
|
The program wvfgrd96 was used with good traces observed at short distance to determine the focal mechanism, depth and seismic moment. This technique requires a high quality signal and well determined velocity model for the Green functions. To the extent that these are the quality data, this type of mechanism should be preferred over the radiation pattern technique which requires the separate step of defining the pressure and tension quadrants and the correct strike.
The observed and predicted traces are filtered using the following gsac commands:
hp c 0.02 n 3
lp c 0.10 n 3
br c 0.12 0.25 n 4 p 2
The results of this grid search from 0.5 to 19 km depth are as follow:
           DEPTH  STK   DIP  RAKE   MW    FIT
WVFGRD96    0.5   105    65   -25   3.59 0.3772
WVFGRD96    1.0   110    80   -10   3.58 0.3973
WVFGRD96    2.0   105    65   -25   3.72 0.4859
WVFGRD96    3.0   105    60   -15   3.75 0.5062
WVFGRD96    4.0   110    60     0   3.77 0.5184
WVFGRD96    5.0   110    60     5   3.79 0.5284
WVFGRD96    6.0   110    60    10   3.81 0.5374
WVFGRD96    7.0   110    60    10   3.83 0.5421
WVFGRD96    8.0   110    55    10   3.87 0.5433
WVFGRD96    9.0   110    60     5   3.87 0.5420
WVFGRD96   10.0   110    60     5   3.88 0.5396
WVFGRD96   11.0   110    65     5   3.89 0.5351
WVFGRD96   12.0   110    65     5   3.90 0.5301
WVFGRD96   13.0   110    65     0   3.91 0.5228
WVFGRD96   14.0   110    65     0   3.92 0.5143
WVFGRD96   15.0   290    65    -5   3.93 0.5062
WVFGRD96   16.0   290    65    -5   3.94 0.4986
WVFGRD96   17.0   290    70    -5   3.95 0.4894
WVFGRD96   18.0   290    70    -5   3.96 0.4805
WVFGRD96   19.0   290    70    -5   3.97 0.4697
WVFGRD96   20.0   290    70    -5   3.98 0.4586
WVFGRD96   21.0   290    65    -5   3.98 0.4477
WVFGRD96   22.0   290    65    -5   3.99 0.4364
WVFGRD96   23.0   290    65    -5   4.00 0.4246
WVFGRD96   24.0   290    65    -5   4.00 0.4135
WVFGRD96   25.0   290    65    -5   4.01 0.4013
WVFGRD96   26.0   290    60    -5   4.02 0.3885
WVFGRD96   27.0   290    65    -5   4.02 0.3768
WVFGRD96   28.0    20    85   -15   4.02 0.3721
WVFGRD96   29.0    20    85   -15   4.03 0.3695
The best solution is
WVFGRD96 8.0 110 55 10 3.87 0.5433
The mechanism correspond to the best fit is

|
|
|
The best fit as a function of depth is given in the following figure:

|
|
|
The comparison of the observed and predicted waveforms is given in the next figure. The red traces are the observed and the blue are the predicted. Each observed-predicted componnet is plotted to the same scale and peak amplitudes are indicated by the numbers to the left of each trace. The number in black at the rightr of each predicted traces it the time shift required for maximum correlation between the observed and predicted traces. This time shift is required because the synthetics are not computed at exactly the same distance as the observed and because the velocity model used in the predictions may not be perfect. A positive time shift indicates that the prediction is too fast and should be delayed to match the observed trace (shift to the right in this figure). A negative value indicates that the prediction is too slow. The bandpass filter used in the processing and for the display was
hp c 0.02 n 3
lp c 0.10 n 3
br c 0.12 0.25 n 4 p 2

|
|
|

|
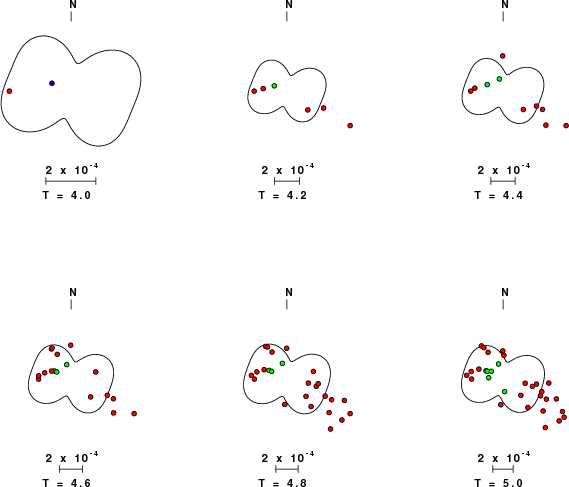
| Focal mechanism sensitivity at the preferred depth. The red color indicates a very good fit to thewavefroms. Each solution is plotted as a vector at a given value of strike and dip with the angle of the vector representing the rake angle, measured, with respect to the upward vertical (N) in the figure. |
The following figure shows the stations used in the grid search for the best focal mechanism to fit the surface-wave spectral amplitudes of the Love and Rayleigh waves.

|
|
|
The surface-wave determined focal mechanism is shown here.
  NODAL PLANES


  STK=      12.36
  DIP=      77.05
 RAKE=     149.13

             OR

  STK=     109.99
  DIP=      60.00
 RAKE=      15.00


DEPTH = 10.0 km

Mw = 3.97
Best Fit 0.9239 - P-T axis plot gives solutions with FIT greater than FIT90
 |
The P-wave first motion data for focal mechanism studies are as follow:
Sta Az(deg) Dist(km) First motion
Surface wave analysis was performed using codes from Computer Programs in Seismology, specifically the multiple filter analysis program do_mft and the surface-wave radiation pattern search program srfgrd96.
Digital data were collected, instrument response removed and traces converted
to Z, R an T components. Multiple filter analysis was applied to the Z and T traces to obtain the Rayleigh- and Love-wave spectral amplitudes, respectively.
These were input to the search program which examined all depths between 1 and 25 km
and all possible mechanisms.

|
|
|

|
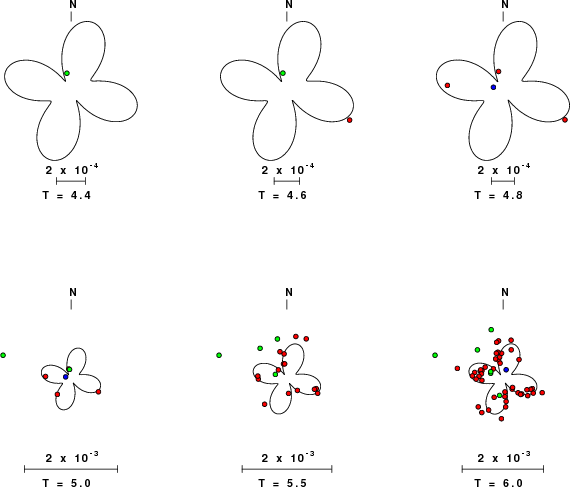
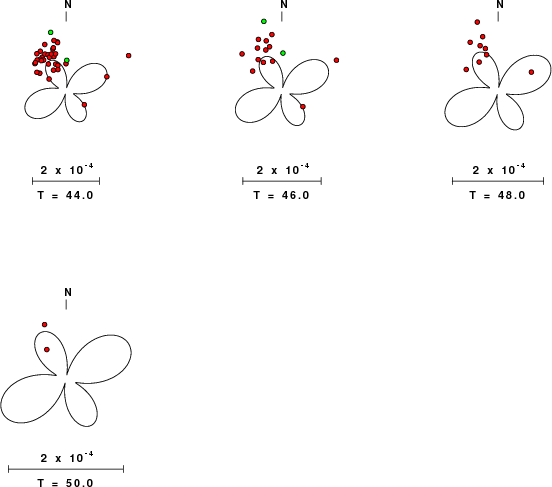
| Pressure-tension axis trends. Since the surface-wave spectra search does not distinguish between P and T axes and since there is a 180 ambiguity in strike, all possible P and T axes are plotted. First motion data and waveforms will be used to select the preferred mechanism. The purpose of this plot is to provide an idea of the possible range of solutions. The P and T-axes for all mechanisms with goodness of fit greater than 0.9 FITMAX (above) are plotted here. |

|
| Focal mechanism sensitivity at the preferred depth. The red color indicates a very good fit to the Love and Rayleigh wave radiation patterns. Each solution is plotted as a vector at a given value of strike and dip with the angle of the vector representing the rake angle, measured, with respect to the upward vertical (N) in the figure. Because of the symmetry of the spectral amplitude rediation patterns, only strikes from 0-180 degrees are sampled. |
The distribution of broadband stations with azimuth and distance is
Sta Az(deg)    Dist(km)
Q13A	   12	  135
U12A	  187	  149
Q14A	   34	  165
Q11A	  317	  166
S15A	   92	  174
U11A	  212	  175
U14A	  145	  181
R10A	  289	  182
R15A	   74	  188
P13A	    8	  190
T15A	  115	  192
TPNV	  242	  192
P12A	  346	  196
S10A	  276	  199
V13A	  171	  214
Q10A	  304	  215
Q15A	   51	  220
V12A	  192	  230
P14A	   28	  231
U10A	  230	  231
P11A	  329	  234
U15A	  128	  235
V11A	  205	  235
R09A	  283	  246
S09A	  270	  254
V14A	  155	  261
O13A	    7	  265
T16A	  108	  265
P15A	   41	  269
Q09A	  296	  276
P10A	  319	  277
W12A	  190	  277
O12A	  353	  280
O11A	  337	  287
V15A	  138	  290
W13A	  172	  298
DUG	   26	  301
W14A	  158	  304
Q16A	   64	  305
LDF	  193	  306
P16A	   48	  310
S17A	   92	  312
P09A	  310	  314
O15A	   30	  323
T17A	  104	  324
R17A	   76	  326
O10A	  327	  337
Q08A	  292	  337
R08A	  282	  337
S08C	  266	  339
ELK	  347	  340
W15A	  146	  342
N13A	    2	  344
N12A	  350	  348
GSC	  220	  351
U17A	  110	  351
X13A	  172	  355
N14A	   16	  357
N11A	  341	  360
O09A	  318	  364
WUAZ	  132	  364
O16A	   41	  366
P17A	   58	  366
N10A	  331	  378
N15A	   24	  381
S18A	   90	  383
W16A	  139	  388
X14A	  160	  388
P08A	  305	  390
Q18A	   67	  396
R18A	   79	  396
M13A	    2	  400
T18A	   99	  401
M12A	  353	  409
X15A	  152	  410
P18A	   59	  412
Q07A	  290	  412
R07C	  276	  415
M14A	   11	  424
U18A	  109	  424
M11A	  343	  426
N16A	   35	  428
HELL	  255	  433
O08A	  312	  433
ISA	  239	  437
N09A	  322	  439
Y13A	  174	  440
W17A	  131	  441
Y14A	  164	  441
M15A	   21	  442
P07A	  298	  442
Y12C	  182	  445
R19A	   81	  450
X16A	  144	  454
V18A	  119	  455
R06C	  282	  456
M10A	  336	  458
M16A	   30	  458
S19A	   89	  458
Y15A	  156	  460
Q19A	   72	  463
N17A	   40	  465
O18A	   52	  467
N08A	  317	  468
O07A	  306	  475
L13A	    4	  482
T19A	  101	  482
T06C	  262	  483
L14A	   11	  484
S06C	  273	  485
M09A	  328	  486
L12A	  353	  490
X17A	  139	  496
L15A	   19	  500
WCN	  292	  502
Y16A	  148	  502
L11A	  347	  504
Z14A	  165	  504
W18A	  124	  506
L10A	  340	  513
R05C	  284	  513
MWC	  222	  516
MVCO	   95	  520
N07B	  311	  521
GLA	  185	  524
V19A	  114	  524
P06A	  296	  528
S05C	  267	  531
W19A	  122	  532
CMB	  275	  533
X18A	  131	  533
L16A	   27	  534
Z15A	  158	  534
M08A	  321	  536
N18A	   47	  537
U05C	  255	  538
K14A	   10	  540
K12A	  355	  543
K13A	    2	  543
O06A	  301	  545
Y17A	  144	  551
L09A	  330	  552
113A	  174	  556
Z16A	  151	  557
LAVA	  283	  571
BEK	  296	  572
P05C	  289	  573
K11A	  346	  575
M07A	  316	  578
N06A	  307	  579
112A	  182	  580
R04C	  277	  582
X19A	  128	  586
Y18A	  137	  589
109C	  206	  596
K10A	  340	  597
L08A	  326	  599
BAR	  201	  602
Z17A	  144	  607
K16A	   22	  610
J12A	  354	  613
S04C	  270	  617
K09A	  333	  619
AHID	   25	  620
O05C	  295	  621
Y19A	  131	  624
116A	  157	  625
J13A	    1	  626
Q04C	  283	  627
WVOR	  326	  635
ELFS	  302	  636
L07A	  319	  637
J11A	  349	  640
SAO	  262	  640
HLID	  360	  644
V03C	  255	  644
O04C	  298	  649
Z18A	  142	  649
M06C	  308	  652
K08A	  329	  655
214A	  167	  659
HAST	  259	  659
J10A	  343	  662
117A	  149	  663
SUTB	  286	  670
Q03C	  280	  679
I13A	    2	  684
J09A	  336	  684
MOD	  314	  687
BW06	   35	  688
K07A	  324	  688
REDW	   24	  688
216A	  157	  691
118A	  144	  694
I11A	  349	  696
BNLO	  267	  697
HATC	  301	  701
M05C	  306	  708
O03C	  293	  712
J08A	  332	  713
119A	  139	  719
L05A	  313	  731
MOOW	   23	  731
I10A	  344	  732
217A	  153	  738
I09A	  338	  747
RWWY	   52	  750
218A	  147	  752
J07A	  328	  752
K06A	  320	  752
MCCM	  276	  752
H12A	  357	  755
H13A	    0	  755
I08A	  334	  770
M03C	  303	  774
HOPS	  283	  775
O02C	  293	  779
M04C	  307	  782
J06A	  323	  783
H11A	  350	  784
K05A	  317	  784
Y22C	  119	  784
H10A	  346	  785
219A	  142	  790
ISCO	   71	  791
P01C	  286	  806
318A	  149	  807
L04A	  310	  810
G13A	    1	  814
H09A	  341	  816
I07A	  330	  825
BMO	  344	  826
K04A	  313	  828
G14A	    5	  834
H08A	  336	  834
M02C	  302	  835
G15A	   10	  837
YBH	  304	  841
N02C	  296	  844
I06A	  326	  846
319A	  145	  847
J05A	  319	  847
G11A	  350	  863
O01C	  291	  863
G10A	  345	  868
H07A	  332	  876
G09A	  342	  883
F12A	  355	  891
F13A	    0	  892
J04A	  315	  896
F14A	    5	  898
HUMO	  309	  909
F15A	    9	  910
F11A	  351	  915
I05A	  323	  919
G08A	  337	  920
RLMT	   26	  920
H06A	  329	  923
L02A	  305	  929
F09A	  343	  931
F10A	  346	  943
G07A	  334	  944
M01C	  302	  952
I04A	  317	  955
K02A	  308	  955
H05A	  325	  958
E13A	    1	  964
E14A	    4	  964
F08A	  339	  965
E11A	  351	  967
E15A	    8	  972
G06A	  330	  982
E10A	  348	  995
J02A	  311	  998
MSO	    2	 1008
H04A	  322	 1011
G05A	  327	 1014
F07A	  335	 1015
I03A	  315	 1020
E09A	  343	 1021
D13A	  360	 1037
D14A	    4	 1037
F06A	  331	 1037
D15A	    8	 1042
D11A	  352	 1044
E08A	  340	 1045
HAWA	  338	 1050
I02A	  314	 1057
D10A	  348	 1060
MNTX	  127	 1060
H03A	  318	 1073
E07A	  337	 1077
F05A	  329	 1078
D09A	  344	 1083
D08A	  341	 1099
C13A	  359	 1102
C14A	    2	 1113
H02A	  317	 1115
E06A	  333	 1118
G03A	  321	 1121
F04A	  326	 1127
C10A	  349	 1143
E05A	  330	 1153
C09A	  345	 1160
D06A	  335	 1175
C08A	  342	 1178
B13A	  360	 1179
AMTX	  102	 1180
F03A	  323	 1186
NEW	  350	 1188
B10A	  350	 1194
B12A	  356	 1194
LAO	   31	 1195
B11A	  353	 1197
C07A	  339	 1197
E04A	  328	 1199
EGMT	   17	 1199
D05A	  332	 1220
B09A	  347	 1224
E03A	  325	 1236
A13A	  360	 1241
B08A	  343	 1245
A12A	  356	 1246
C06A	  337	 1248
D04A	  329	 1249
A11A	  353	 1254
C05A	  334	 1256
A10A	  349	 1273
B07A	  340	 1277
CBKS	   80	 1281
A09A	  346	 1292
D03A	  326	 1295
A08A	  344	 1305
C04A	  330	 1311
NLWA	  327	 1323
B05A	  334	 1325
B06A	  336	 1327
A07A	  341	 1345
B04A	  330	 1365
A06A	  338	 1384
A04A	  334	 1392
A05A	  336	 1396
WMOK	   99	 1436
DGMT	   31	 1445
KSU1	   79	 1553
JCT	  117	 1563
ECSD	   60	 1633
SCIA	   69	 1861
MIAR	   95	 1898
AGMN	   46	 1899
NATX	  104	 1916
FVM	   82	 2098
SLM	   80	 2107
JFWS	   67	 2117
EYMN	   51	 2171
HDIL	   74	 2179
PVMO	   86	 2189
MPH	   90	 2201
SIUC	   82	 2208
VBMS	   99	 2253
OXF	   92	 2266
OLIL	   79	 2292
USIN	   81	 2339
PLAL	   90	 2369
BLO	   78	 2423
BRAL	   98	 2608
AAM	   69	 2652
TZTN	   83	 2726
BLA	   81	 2984
NHSC	   89	 3127
PAL	   71	 3471
LBNH	   65	 3599
Since the analysis of the surface-wave radiation patterns uses only spectral amplitudes and because the surfave-wave radiation patterns have a 180 degree symmetry, each surface-wave solution consists of four possible focal mechanisms corresponding to the interchange of the P- and T-axes and a roation of the mechanism by 180 degrees. To select one mechanism, P-wave first motion can be used. This was not possible in this case because all the P-wave first motions were emergent ( a feature of the P-wave wave takeoff angle, the station location and the mechanism). The other way to select among the mechanisms is to compute forward synthetics and compare the observed and predicted waveforms.
The fits to the waveforms with the given mechanism are show below:

|
This figure shows the fit to the three components of motion (Z - vertical, R-radial and T - transverse). For each station and component, the observed traces is shown in red and the model predicted trace in blue. The traces represent filtered ground velocity in units of meters/sec (the peak value is printed adjacent to each trace; each pair of traces to plotted to the same scale to emphasize the difference in levels). Both synthetic and observed traces have been filtered using the SAC commands:
hp c 0.02 n 3
lp c 0.10 n 3
br c 0.12 0.25 n 4 p 2

|

|
Should the national backbone of the USGS Advanced National Seismic System (ANSS) be implemented with an interstation separation of 300 km, it is very likely that an earthquake such as this would have been recorded at distances on the order of 100-200 km. This means that the closest station would have information on source depth and mechanism that was lacking here.
Dr. Harley Benz, USGS, provided the USGS USNSN digital data. The digital data used in this study were provided by Natural Resources Canada through their AUTODRM site http://www.seismo.nrcan.gc.ca/nwfa/autodrm/autodrm_req_e.php, and IRIS using their BUD interface
The WUS used for the waveform synthetic seismograms and for the surface wave eigenfunctions and dispersion is as follows:
MODEL.01
Model after     8 iterations
ISOTROPIC
KGS
FLAT EARTH
1-D
CONSTANT VELOCITY
LINE08
LINE09
LINE10
LINE11
      H(KM)   VP(KM/S)   VS(KM/S) RHO(GM/CC)         QP         QS       ETAP       ETAS      FREFP      FREFS
     1.9000     3.4065     2.0089     2.2150  0.302E-02  0.679E-02   0.00       0.00       1.00       1.00
     6.1000     5.5445     3.2953     2.6089  0.349E-02  0.784E-02   0.00       0.00       1.00       1.00
    13.0000     6.2708     3.7396     2.7812  0.212E-02  0.476E-02   0.00       0.00       1.00       1.00
    19.0000     6.4075     3.7680     2.8223  0.111E-02  0.249E-02   0.00       0.00       1.00       1.00
     0.0000     7.9000     4.6200     3.2760  0.164E-10  0.370E-10   0.00       0.00       1.00       1.00
Here we tabulate the reasons for not using certain digital data sets
The following stations did not have a valid response files:
DATE=Sat Aug 25 15:55:21 CDT 2007