USGS/SLU Moment Tensor Solution
ENS 16228041/-116325328:16322548:01:0 16325328:16322548:01:0 0.00 0.00 0.0 0.0
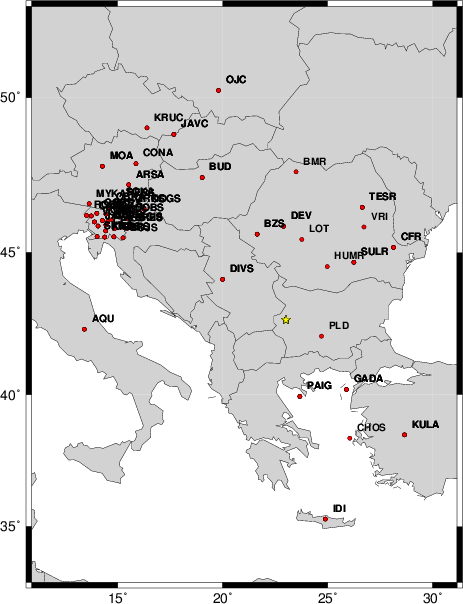
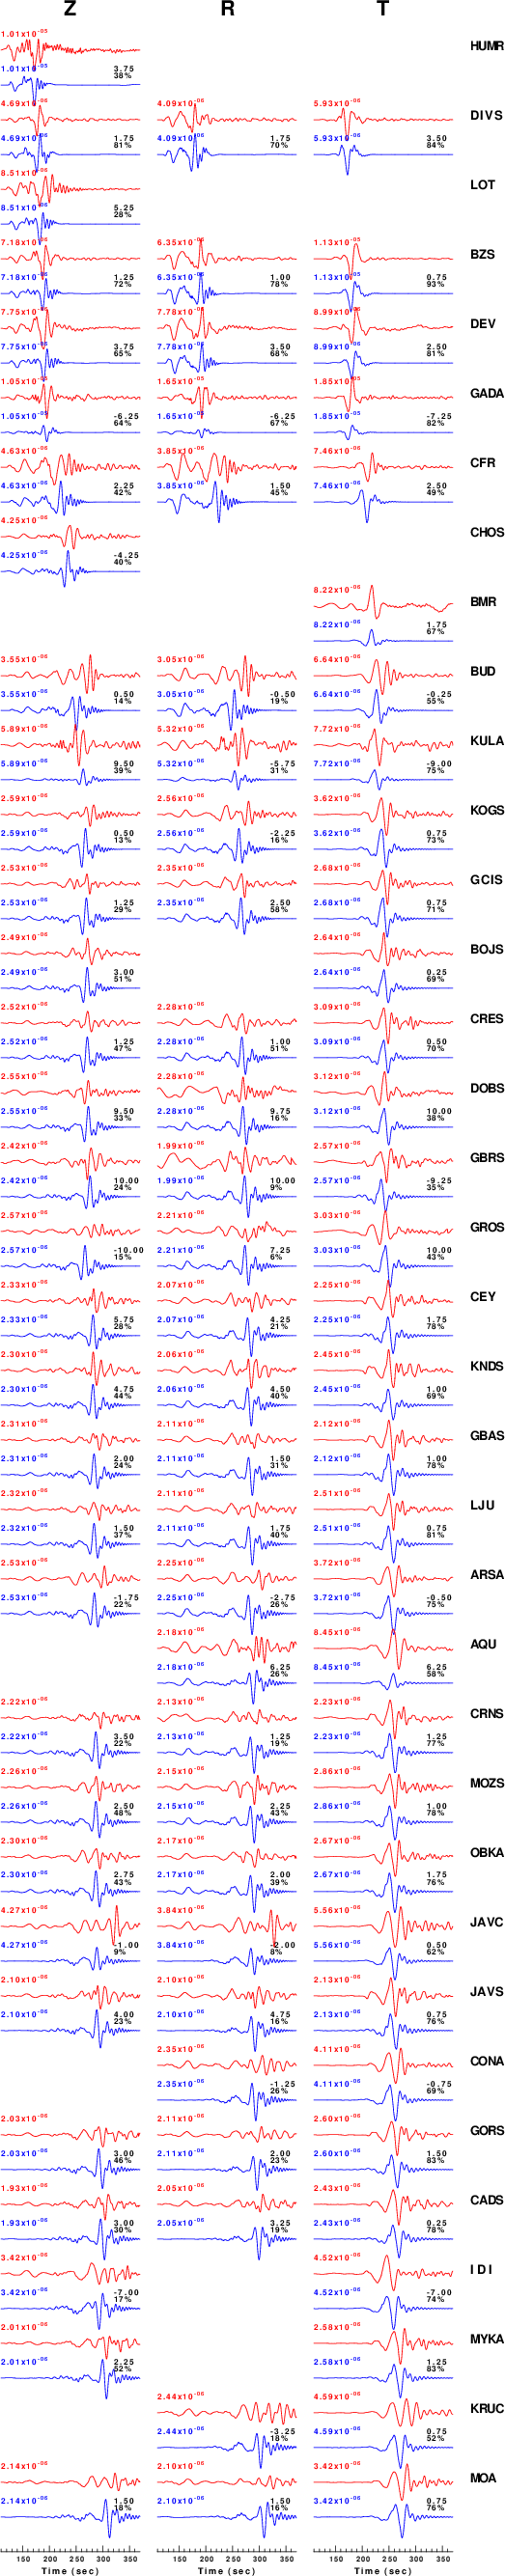
Stations used:
CZ.JAVC CZ.KRUC HT.CHOS HU.BUD KO.GADA KO.KULA MN.AQU
MN.DIVS MN.IDI OE.ARSA OE.CONA OE.MOA OE.MYKA OE.OBKA
RO.BMR RO.BZS RO.CFR RO.DEV RO.DRGR RO.HUMR RO.LOT RO.MLR
SL.BOJS SL.CADS SL.CEY SL.CRES SL.CRNS SL.DOBS SL.GBAS
SL.GBRS SL.GCIS SL.GORS SL.GROS SL.JAVS SL.KNDS SL.KOGS
SL.LJU SL.MOZS
Filtering commands used:
hp c 0.01 n 3
lp c 0.03 n 3
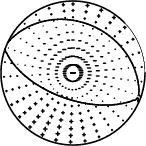
Best Fitting Double Couple
Mo = 2.16e+24 dyne-cm
Mw = 5.49
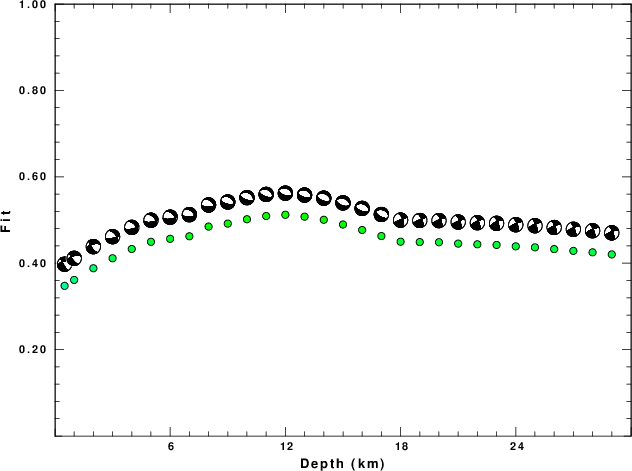
Z = 12 km
Plane Strike Dip Rake
NP1 108 61 -96
NP2 300 30 -80
Principal Axes:
Axis Value Plunge Azimuth
T 2.16e+24 15 203
N 0.00e+00 5 111
P -2.16e+24 74 4
Moment Tensor: (dyne-cm)
Component Value
Mxx 1.55e+24
Mxy 7.05e+23
Mxz -1.08e+24
Myy 2.99e+23
Myz -2.51e+23
Mzz -1.84e+24
##############
######################
########----################
##------------------##########
#------------------------#########
-----------------------------#######
--------------------------------######
------------------- ------------######
#------------------ P --------------####
####---------------- ---------------####
#####---------------------------------####
#######--------------------------------###
##########-----------------------------###
############--------------------------##
################-----------------------#
#####################-------------###-
####################################
##################################
####### ####################
###### T ###################
### ################
##############
Global CMT Convention Moment Tensor:
R T P
-1.84e+24 -1.08e+24 2.51e+23
-1.08e+24 1.55e+24 -7.05e+23
2.51e+23 -7.05e+23 2.99e+23
 USGS/SLU Moment Tensor Solution
 ENS  2012/05/22 00:00:33:1  42.69   23.01   9.4 5.6 Bulgaria

 Stations used:
   CZ.JAVC CZ.KRUC HT.CHOS HU.BUD KO.GADA KO.KULA MN.AQU
   MN.DIVS MN.IDI OE.ARSA OE.CONA OE.MOA OE.MYKA OE.OBKA
   RO.BMR RO.BZS RO.CFR RO.DEV RO.HUMR RO.LOT SL.BOJS SL.CADS
   SL.CEY SL.CRES SL.CRNS SL.DOBS SL.GBAS SL.GBRS SL.GCIS
   SL.GORS SL.GROS SL.JAVS SL.KNDS SL.KOGS SL.LJU SL.MOZS

 Filtering commands used:
   hp c 0.01 n 3
   lp c 0.03 n 3

 Best Fitting Double Couple
  Mo = 2.16e+24 dyne-cm
  Mw = 5.49
  Z  = 12 km
  Plane   Strike  Dip  Rake
   NP1      109    60   -93
   NP2      295    30   -85
  Principal Axes:
   Axis    Value   Plunge  Azimuth
    T   2.16e+24     15     201
    N   0.00e+00      2     111
    P  -2.16e+24     75      11

 Moment Tensor: (dyne-cm)
    Component   Value
       Mxx     1.60e+24
       Mxy     6.54e+23
       Mxz    -1.05e+24
       Myy     2.61e+23
       Myz    -3.07e+23
       Mzz    -1.87e+24


                     ##############
                 ######################
              ############################
             ###-----------------##########
           ##------------------------########
          #----------------------------#######
         --------------------------------######
        #----------------------------------#####
        #------------------   --------------####
       ####---------------- P ---------------####
       #####---------------   ----------------###
       #######--------------------------------###
       ##########------------------------------##
        ############---------------------------#
        ################-----------------------#
         #####################--------------###
          ####################################
           ##################################
             #######   ####################
              ###### T ###################
                 ###   ################
                     ##############


 Global CMT Convention Moment Tensor:
      R          T          P
 -1.87e+24  -1.05e+24   3.07e+23
 -1.05e+24   1.60e+24  -6.54e+23
  3.07e+23  -6.54e+23   2.61e+23


Details of the solution is found at

http://www.eas.slu.edu/eqc/eqc_mt/MECH.NA/20120522000033/index.html
|
USGS Body-Wave Moment Tensor Solution BULGARIA 12/05/22 00:00:33.11 Epicenter: 42.686 23.009 MW 5.6 USGS MOMENT TENSOR SOLUTION Depth 9 No. of sta: 49 Moment Tensor; Scale 10**17 Nm Mrr=-2.54 Mtt= 1.33 Mpp= 1.21 Mrt=-0.52 Mrp=-0.06 Mtp=-1.80 Principal axes: T Val= 3.09 Plg= 3 Azm=224 N -0.46 11 133 P -2.64 79 331 Best Double Couple:Mo=2.9*10**17 NP1:Strike=124 Dip=49 Slip=-104 NP2: 325 43 -74 
|
USGS WPhase Moment Solution BULGARIA 12/05/22 0:00:33 Epicenter: 42.682 23.017 MW 5.6 USGS/WPHASE CENTROID MOMENT TENSOR 12/05/22 00:00:33.00 Centroid: 42.482 23.153 Depth 25 No. of sta: 26 Moment Tensor; Scale 10**17 Nm Mrr=-2.81 Mtt= 1.91 Mpp= 0.90 Mrt=-1.06 Mrp= 0.87 Mtp=-1.27 Principal axes: T Val= 3.08 Plg=13 Azm=214 N = 0.04 1 305 P = -3.12 76 43 Best Double Couple:Mo=3.1*10**17 NP1:Strike=302 Dip=32 Slip= -93 NP2: 126 58 -87 
|
May 22, 2012, BULGARIA, MW=5.6

Howard Koss
Meredith Nettles

CENTROID-MOMENT-TENSOR  SOLUTION
GCMT EVENT:     C201205220000A
DATA: II LD IU DK CU G  GE MN IC
L.P.BODY WAVES:108S, 179C, T= 40
MANTLE WAVES:   60S,  63C, T=125
SURFACE WAVES: 128S, 266C, T= 50
TIMESTAMP:      Q-20120522054611
CENTROID LOCATION:
ORIGIN TIME:      00:00:36.6 0.1
LAT:42.55N 0.01;LON: 23.02E 0.01
DEP: 12.0  FIX;TRIANG HDUR:  1.6
MOMENT TENSOR: SCALE 10**24 D-CM
RR=-2.890 0.028; TT= 2.130 0.028
PP= 0.762 0.027; RT=-1.770 0.081
RP= 0.415 0.088; TP=-1.650 0.023
PRINCIPAL AXES:
1.(T) VAL=  3.680;PLG=15;AZM=211
2.(N)      -0.224;    10;    119
3.(P)      -3.454;    72;    355
BEST DBLE.COUPLE:M0= 3.57*10**24
NP1: STRIKE=316;DIP=32;SLIP= -70
NP2: STRIKE=113;DIP=61;SLIP=-102

            ###########
        ###################
      --------------#########
    -------------------########
   ----------------------#######
  -------------------------######
  #-------------   ---------#####
 ###------------ P ----------#####
 #####----------   -----------####
 #######----------------------####
 #########---------------------###
  ###########------------------##
  ################-------------##
   ###########################--
    #####   ##################-
      ### T #################
        #   ###############
            ###########