 USAGE:genplt -XMIN xmin -XMAX xmax -YMIN ymin -YMAX ymax -X0 x0 -Y0 y0 -NOBOX -XLIN _XLOG _YLIN YLOG -XLOG -XLIN -YLOG -YLIN  -C cmdfil -A acmdfil -? -h
 -XMIN xmin (default 0.0)  minimum value of X-Axis
 -XMAX xmax (default    )  maximum value of X-Axis
 -YMIN ymin (default 0.0)  minimum value of Y-Axis
 -YMAX ymax (default 0.0)  maximum value of Y-Axis
 -X0 x0     (default 2.0)  lower left corner of plot
 -Y0 y0     (default 1.0)  bottom left corner of plot
 -XLEN xlen (default 6.0)  length of X-Axis
 -YLEN ylen (default 6.0)  length of Y-Axis
 -NOBOX     (default false) do not plot axes
 -XLIN      (default linear) X axis is linear
 -XLOG      (default linear) X axis is logarithmic
 -YLIN      (default linear) Y axis is linear
 -YLOG      (default linear) Y axis is logarithmic
 -C cmdfil
    cmdfil consists of one xy-pair file per line as
       File Kolor Width Psymb
     File: file name of x-y pairs to be plotted
         with the File and Psymb enclosed in single quotes
     Kolor: (integer)1=black,1000=red,1050=green,1100=blue
         0=white or any CALPLOT color
     Width: width of line/or symbol border in inches
     Psymb: - a quoted 2 character entry for  the following
            SQ - square
            TR - triangle
            HX - heaxgon
            DI - diamond
            CI - circle
            NO - no symbol - plot a line
 -A acmdfil
    acmdfil consists of one xy-pair file per line as
       File Kolor Width Psymb Size
     File: file name of x-y pairs to be plotted
         with the File and Psymb enclosed in single quotes
     Kolor: (integer)1=black,1000=red,1050=green,1100=blue
         0=white or any CALPLOT color
     Width: width of line/or symbol border in inches
     Psymb: - a quoted 2 character entry for the following
            SQ - square
            TR - triangle
            HX - heaxgon
            DI - diamond
            CI - circle
            NO - no symbol - plot a line
     Size: - Symbol size
 -TX title-x (default none) Must be enclosed in quotes
 -TY title-y (default none) Must be enclosed in quotes
 -?         (default false) online help
 -h         (default false) online help
The program currently permits a total of 100 files to be plotted with each file consisting or 1000 x-y pairs.
An example of the use of this program together
is given DONEW:
genplt -C cmdfil -A acmdfil -TX 'X-axis (m)' -TY 'Y-axis (km)' -XMIN 0 -XMAX 10 -YMIN 0 -YMAX 10
'03.xy' 1 0.05 'NO'
'01.xy' 2 0.00 'SQ'
and
the file acmdfil has the entry:
'02.xy' 1060 0.02 'CI' 0.10
10 10
9 9
8 7
7 8
6 6
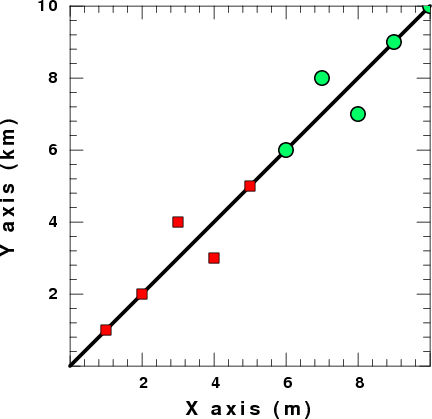
Note the linewidth of the straight line, and the different border widths on the symbols.
Although the brder width of the square symbol was set to 0.0 in cmdfil, this value is overridden by the -W10 argument used by plotnps when the figure was made.